

Welcome to the latest edition of Dividend Hunter. In the past few weeks, we have looked at companies where strong cash flows could translate into consistent dividends going forward.
This includes a debt-free IT Player offering a 7% yield, aPSU offeringa6%yield,a port company offering a 5.4% dividend yield, and a lubricant player offering a 5.1% dividend yield. In our last edition, we covered an AI stock offering 5% yield. In this edition of Dividend Hunter, we cover a business that has long been a cash generator and has a 4.2% dividend yield.
The global energy sector is capital-intensive, with corporate giants often forced to choose between funding future exploration, navigating volatile commodity cycles, or rewarding their shareholders.
However, Oil and Natural Gas Corporation Limited (ONGC), India’s Maharatna upstream behemoth, defies this conventional logic. ONGC is the undisputed backbone of India’s energy security, commanding a staggering 72.8% share of domestic crude oil output and 63.3% of the nation’s total hydrocarbon production.
Yet, the company is not resting on its achievements. It is pivoting toward a sustainable future, with a massive ₹2 lakh crore investment to achieve Net Zero Scope-1 and Scope-2 emissions by 2038. At the same time, ONGC isn’t letting this massive investment become an excuse to squeeze shareholders.
ONGC’s Dividend DNA: A Legacy of Rewarding Shareholders
Instead, their core philosophy is to pass the wealth directly back to the people who invest in them. In FY25, ONGC returned ₹15,411 crore to its shareholders, maintaining a solid 43.27% dividend payout ratio. The Board recently even doubled down.
ONGC Historical Dividend Payout
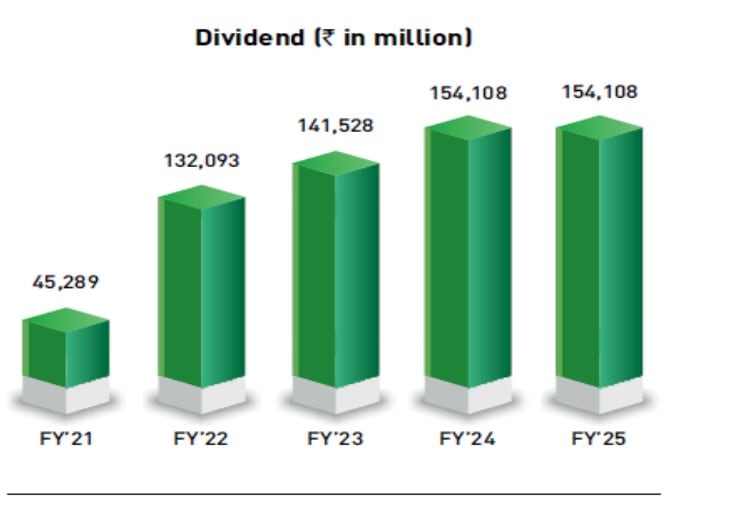
During 9MFY26, they declared the highest-ever cumulative interim dividend of ₹15,411 crore. For dividend hunters, ONGC looks like the ultimate package: a cash-rich business funding India’s green future while also returning surplus capital to shareholders.
But with the unpredictable global crude prices and a massive ₹2 lakh crore planned investment, is this generous dividend yield actually sustainable in the long run? Let’s find out.
The Maharatna Advantage: ONGC’s Operational Dominance
ONGC is India’s premier energy company and a Maharatna Central Public Sector Enterprise. ONGC is the leader in the domestic Exploration and Production (E&P) sector.
It possesses a deeply integrated portfolio spanning upstream, midstream, and downstream operations. It is rapidly expanding its footprint in green energy.
The company is ranked 180th globally and 5th in India on the Fortune Global 500 list for 2024, and holds the 220th global position on the Forbes 2000 list for 2025.
Today, ONGC commands a 63.3% share of the nation’s total hydrocarbon production, contributing 72.8% of India’s domestic crude oil output and 55.8% of its natural gas.
The company’s operational scale is vast, supported by 268 offshore facilities, 69 drilling rigs, and an extensive network of over 25,500 Kilometers of pipelines. In FY25, standalone crude oil production stood at 18.558 MMT, and natural gas production was 19.654 BCM.
Production Outlook: Reversing the Decade-Long Output Decline
Notably, ONGC scripted a major turnaround in FY25 by recording its first standalone crude output growth in nearly a decade, rising by 0.9%. The company maintains a highly aggressive exploration strategy. In FY25 alone, ONGC notified 9 new hydrocarbon discoveries (5 onland and 4 offshore) and monetized 8 discoveries.
Furthermore, ONGC was awarded 15 new contract areas under the OALP Bid Round-IX, covering a sprawling 82,560.26 square kilometers. ONGC also holds a controlling stake in ONGC Videsh, HPCL, MRPL, and ONGC Petroadditions.
Financial Performance: Revenue Stability Amid Crude Volatility
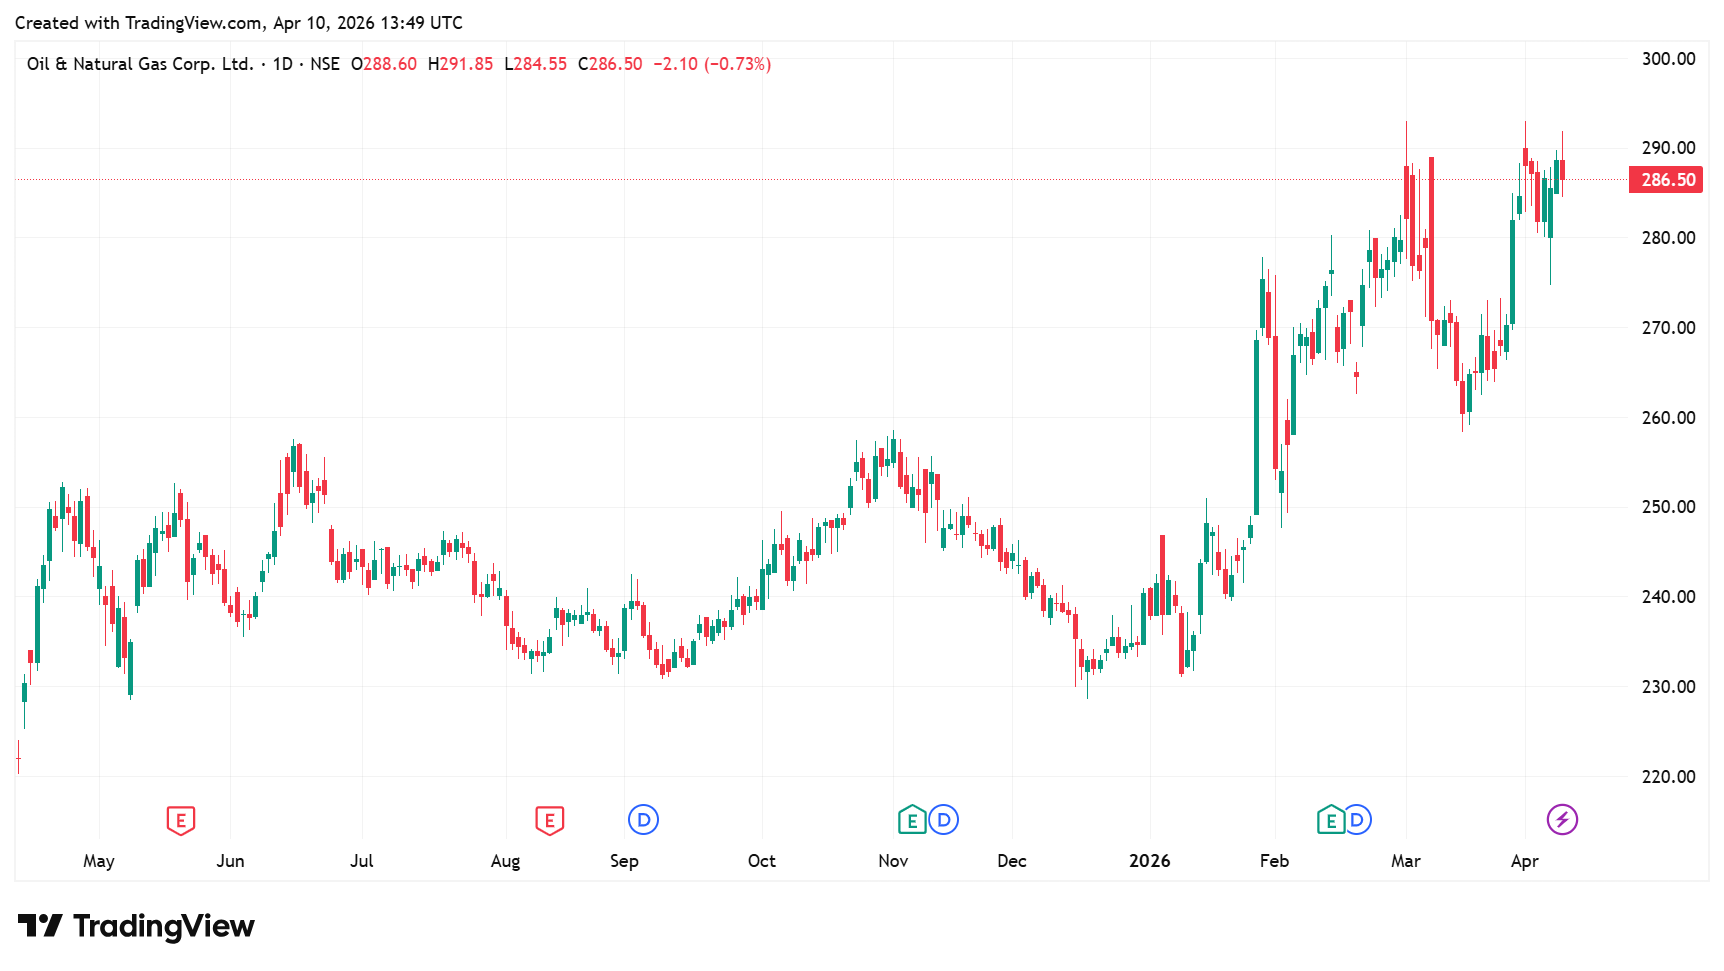
The company’s market cap is ₹3,63,000 crore, as of 09 April 2026.
Over the last 5 years, net profit has grown at a 17% CAGR.
Standalone revenue was flat (-0.4%) to ₹1,37,846 crore in FY25, as crude oil price realization fell to US $76.9, down from US $80.8 in FY24.
PBIDT (Profit Before Interest, Depreciation & Tax) declined 2.4% to ₹75,716 crore, with a robust margin of 54.9%. Standalone net profit declined by 12.1% to ₹35,610 crore, due to higher exploratory write-offs and lower global crude prices.
Further, the consolidated financials rebounded and grew strongly in 9MFY26.
ONGC 1-Year Share Price Chart
Revenue declined 6.1% year-on-year to ₹96,581 crore in 9MFY26, due to lower crude oil price realizations. Operating profit fell 4.3% to ₹49,056 crore, with a 50.8% margin. As a result, net profit declined 10% to ₹26,244 crore.
Capital Efficiency: Why ONGC’s 26.5% ROCE Matters for Investors
The company’s return ratios remain robust. Consolidated Return on Capital Employed (ROCE) stood at 26.5% in FY25, while Return on Net Worth stands at 11.3%. This underscores its efficient exploration and production operations and its ability to generate earnings from its capital base.
Cash Flow Engine: Converting Crude into Consistent Payouts
ONGC has a strong and consistent track record of rewarding its shareholders. Consequently, the company prioritizes returning its surplus capital to its investors through consistent and generous dividends.
The primary engine supporting the company’s dividend policy is its massive cash flow from operating activities. In FY25, its standalone net operating cash flow stood at a massive ₹73,010 crore, up from ₹65,335 crore in FY24.
ONGC enjoys predictable, stable demand driven by consistent energy needs. While this business is highly capital-intensive rather than ‘asset-light’, ONGC’s scale and domestic market dominance enable it to convert its earnings into cash flows.
The company boasts a healthy current ratio of 1.4:1 and a strong standalone working capital position of ₹15,088 crore. This allows it to easily meet its current liabilities through internal accruals while maintaining cash reserves. It is also debt-free.
As a result, a maximum portion of operating cash flow becomes available to be returned to shareholders after operational needs are met. As of 31 March 2025, ONGC had a robust standalone cash and bank balance of ₹15,495 crore.
Cash flow directly translates into dividends. Even after comfortably funding internal investments, the surplus cash is distributed to shareholders.
This systemic approach has allowed it to return a staggering ₹15,411 crore to its shareholders in FY25 alone, representing a 43.27% payout ratio. And ONGC has already matched last year’s total dividend payout of ₹15,411 crore in the first 9M of FY26.
It has already distributed this entire amount (₹15,411 crore) as interim dividends in just 9MFY26, marking its highest-ever interim dividend payout.
Dividend Analysis: Sustainable 4.2% Yield and Future Payout Visibility
On the back of such cash flow, the company has already paid an interim dividend of ₹12.25 per share in FY26 Year-To-Date (YTD), equivalent to last year’s dividend. This translates to a dividend yield (at a price of ₹290 per share) of 4.2% YTD in FY26.
Historically, ONGC has paid dividends each year for the past 5 financial years. Furthermore, the dividend increased every year from FY22 to FY24, and is likely to exceed the FY25/FY24 dividend again in FY26. It also paid a total dividend of ₹12.25 per share in FY25.
Historical dividend payout remains robust, too. The company also paid ₹12.25 dividend per share in FY24, followed by ₹11.25 in FY23, and ₹10.5 (FY22), and ₹8.60 in FY21.
The dividend payout has consistently been less than the 100% threshold required by our filter. This suggests that dividends could stay robust in the coming years.
In addition, since ONGC is an upstream company, its realizations are directly linked to global crude benchmarks, such as Brent. Higher crude oil prices also boost its bottom line.
ONGC’s financial sensitivity analysis reveals that a US$ 1 fluctuation in the prices of crude oil, natural gas, and value-added products translates into a ₹5,643 crore shift in its revenue from operations.
Thus, with the recent increase in Brent Crude price, ONGC’s top and bottom lines can increase. That said, ONGC operates under a regulated ecosystem, and the growth could be hit if the government levies windfall taxes.
Future Growth Drivers: Deepwater Expansion and New Well Premiums
Looking ahead, ONGC has set a firm production target of 42.5 MMTOE for FY27, comprising 21 MMT of crude oil and 21.5 BCM of natural gas.
This growth is expected to be supported by a robust pipeline of 21 major projects under implementation. ONGC is investing over ₹65,000 crore, a critical step for sustaining production momentum.
Key drivers for this future production include KG-DWN-98/2 Deepwater Block, Daman Upside Development Project (DUPD), Revitalizing Mature Fields, and Frontier Exploration.
Deepwater operations will provide a massive upside. With all required modules now installed, gas production from this block is expected to commence in Q1FY27 and ramp up to a peak of 5-6 MMSCMD by the end of FY27.
Oil production from this block is also expected to peak at 35,000-40,000 barrels of oil per day (bopd). The DUPD shallow-water gas project was scheduled to commence first gas flows in March 2026. The project is expected to quickly ramp up to a peak output of 4-5 MMSCMD by July 2026.
To mitigate the natural 6%-8% annual decline in legacy offshore fields, ONGC has engaged BP as a Technical Services Provider (TSP) for the Mumbai High field. This partnership has already successfully arrested the field’s decline, turning production trajectories positive. It is contractually committed to deliver an additional 10 MMT of production over ten years.
In exploration, ONGC is expanding its exploration footprint, undertaking an ultra-deepwater drilling campaign in the Andaman Basin. It is targeting depths of up to 5,000 meters and securing 15 new blocks covering 82,560 square kilometers in the recent OALP Bid Round-IX.
To support these expansions, ONGC has guided for a sustained standalone CapEx of around ₹33,000 crore for FY27. The growing revenue share of “new well gas” is expected to support future profitability.
New Well Gas: The 20% Premium Advantage
The government’s pricing guidelines allow gas produced from new wells to command a 20% premium over standard APM (Administered Pricing Mechanism) gas prices.
To this end, ONGC expects the share of new-well gas in its portfolio to increase from 18% to 24% in FY27. This will substantially boost natural gas realizations and profitability.
Furthermore, ONGC also plans to officially enter the energy trading sector.
Green Hydrogen & Solar: The ₹2 Lakh Crore Survival Strategy
In addition, ONGC is leveraging its current financial strength to reinvent its business model and align it with the global energy transition. The company has committed a staggering ₹2 lakh crore to achieve Net Zero Scope-1 and Scope-2 emissions by 2038.
This green transition focuses on scaling up renewable energy infrastructure. Through its subsidiary, ONGC Green, the company has aggressively acquired wind and solar assets, adding 2.3 gigawatt (GW) of capacity. It aims to establish 10 GW of renewable energy capacity by 2030.
Furthermore, ONGC is laying the groundwork for next-generation clean energy technologies. The company has signed strategic Memoranda of Understanding (MOU) with entities such as BHEL and Tata Power. The MoU is to explore the Green Hydrogen and battery energy storage systems.
Valuation Audit: Is ONGC Trading at a Discount to Sector Peers?
Valuation-wise, ONGC trades at an EV/EBITDA multiple of 5.0x, at a premium to the 10-year historical median of 4.2X. The valuation is at a discount to Oil India (8.4X).
The Verdict: Is ONGC the Ultimate Addition to Your Dividend Watchlist?
ONGC meets the key Dividend Hunter filters. It has a steady profit growth, strong cash flows, and a payout ratio within thresholds.
Given a yield of 4.2%, strong profitability, and a historical record of dividend payments, it appears likely that the dividend payout trend will continue.
Dividend hunters should add this stock to their watchlist and see if it continues to reward shareholders with a lucrative dividend yield.
Disclaimer:
Note: Throughout this article, we have relied on data from http://www.Screener.in and the company’s investor presentation. Only in cases where the data were unavailable have we used an alternative, widely accepted, and widely used source of information.
The purpose of this article is only to share interesting charts, data points, and thought-provoking opinions. It is NOT a recommendation. If you wish to consider an investment, you are strongly advised to consult your advisor. This article is strictly for educational purposes only.
About the Author: Madhvendra has been deeply immersed in the equity markets for over seven years, combining his passion for investing with his expertise in financial writing. With a knack for simplifying complex concepts, he enjoys sharing his honest perspectives on startups, listed Indian companies, and macroeconomic trends.
A dedicated reader and storyteller, Madhvendra thrives on uncovering insights that inspire his audience to deepen their understanding of the financial world.
Disclosure: The writer and his dependents do not hold the stocks discussed in this article.
The website managers, its employee(s), and contributors/writers/authors of articles have or may have an outstanding buy or sell position or holding in the securities, options on securities, or other related investments of issuers and/or companies discussed therein. The articles’ content and data interpretation are solely the personal views of the contributors/ writers/authors. Investors must make their own investment decisions based on their specific objectives, resources, and only after consulting such independent advisors as may be necessary.


