
 – Stock Insights News")
Capital efficiency shows how well a company uses its capital to generate returns. A company may own factories, plants, technology, brands, people or distribution networks. The key question is simple. How much profit can it generate from the capital used in the business? A high return on capital employed, or RoCE, usually means the company is using its resources well.
This matters because growth alone is not enough. Some companies need heavy borrowing or constant capital spending to grow. Others can grow while using capital more efficiently. Such companies often have better balance sheets. They may also have more room to reinvest, generate cash and reward shareholders over time.
In this article, we look at Indian companies that combine high capital efficiency with strong business growth. The idea is not to find companies with high RoCE alone. We also check whether they are growing sales and profits. This helps avoid companies that look efficient but are stagnant.
For the screen, we used companies with market capitalisation above Rs 5,000 crore. We filtered for return on capital employed (RoCE) above 30%, return on equity (RoE) above 18%, 3-year sales growth above 15%, and 3-year profit growth above 15%. We also looked for companies with positive free cash flow and positive cash flow from operations in the latest year.
Banks, NBFCs, insurance companies , asset management companies, exchanges, depositories and other financial businesses were excluded. The final selection was based on companies with high RoCE and visible growth, not high returns alone.
#1 Tips Music: Unpacking a 122% RoCE Asset-Light Royalty Engine Across Streaming Platforms
Tips Music, formerly known as Tips Industries, is a music content company focused on creating, acquiring and monetising music copyrights. It is one of India’s leading music labels.
Tips Music Financial Performance
| Metric | Tips Music |
| FY26 revenue growth YoY | 21% |
| FY26 PAT growth YoY | 30% |
| RoCE | 122% |
| RoE | 92.3% |
| EV/EBITDA | 27.9x |
| 5-year EV/EBITDA | 29.3x |
Tips Music reported a strong FY26, helped by steady catalogue consumption and better monetisation across digital and non-digital revenue streams. For FY26, revenue grew 21% to Rs 375.5 crore, while PAT increased 30% to Rs 216.6 crore.
The Streaming Royalty Engine: Decoding a 122% Asset-Light Operating Model
The company’s capital efficiency remains the key point in this case. Tips reported RoCE of 122% and RoE of 92.3%. These are unusually high numbers for a listed operating business. The model is asset-light. The company owns and monetises music rights, rather than relying on heavy physical assets. This helps explain why profit growth has come with strong return ratios.
Catalogue Monetisation: How 90s Repertoire Minimises Expensive New Content Risk
Growth was not only driven by the latest quarter. The company’s 3-year sales compounded annual growth rate (CAGR) stood at 26%, while 3-year profit CAGR was 42%. This reduces the risk of treating Tips as a stagnant high-RoCE company. Its catalogue continues to drive usage across platforms. Management said the 90s repertoire performed well during the quarter, with several older songs trending across Instagram, YouTube and other platforms.
Tips released 66 new songs during Q4 FY26. This included 47 film songs and 19 non-film songs. Its YouTube subscriber base reached 153 million. Digital revenue formed around 70% of FY26 revenue, while non-digital revenue contributed around 30%. Management said brand publishing and public performance also performed well during the year.
The company is also building growth visibility for FY27. Management has guided for around 20% revenue growth and 20% profit growth for the year. It also said content spending could rise to around Rs 80-90 crore, depending on the quality and pricing of available content. Two films, including Hai Jawani Toh Ishq Hona Hai and Main Wapas Aaunga, are expected to be accounted for in Q1 FY27.
Tips has also shown some appetite for selective acquisition. The company acquired a Gujarati-Kutchhi music channel, adding around 4,000 songs to its catalogue. Management said it remains open to more such acquisitions, but only where pricing and recovery potential are reasonable. This is important because the music rights market remains competitive.
Valuation is not cheap, but it is not far from its own history. The stock trades at an EV/EBITDA of 27.9 times, compared with its 5-year average of 29.3 times. However, it is cheaper compared to its peer EV/EBITDA of 10.4. For investors, the key question is whether the company can sustain high growth without overpaying for new content.
Tips Music fits the capital-efficiency theme because it combines high RoCE, strong cash generation and an asset-light business model. The risk is that content acquisition is expensive and growth can be uneven across quarters. Still, the company’s large catalogue, digital reach and improving non-digital revenue streams give it more visibility than a regular high-return but stagnant business.
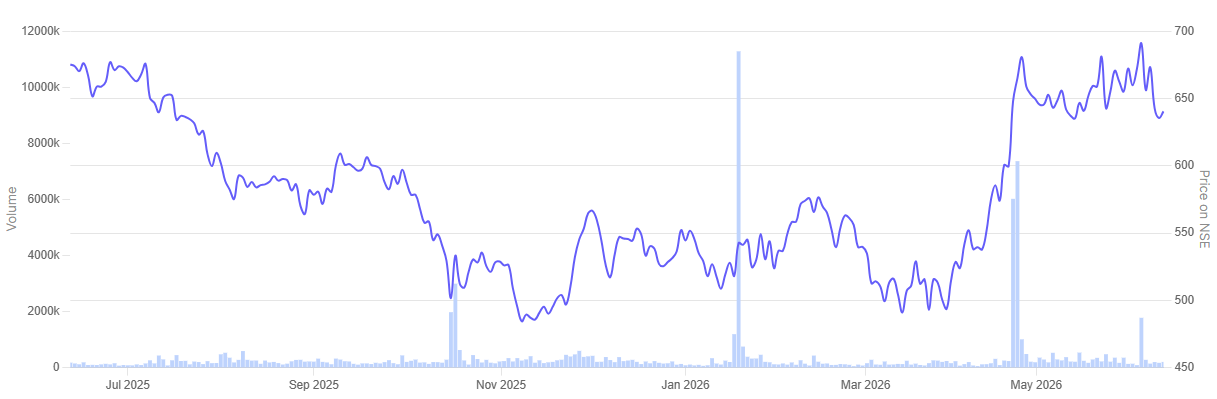
In the past year, the share price of Tips Music is down 4.8%.
Tips Music 1 Year Share Price Chart
#2 Waaree Renewable Technologies: Balancing a 2.83 GWp Order Moat Against Volatile Solar EPC Margins
Incorporated in 1999, Waaree Renewables Technologies is engaged in the business of generation of power through renewable energy sources. The company also provides consultancy services in this regard. Waaree Energy is one of the largest vertically integrated new energy companies.
Waaree Renewables Technologies Financial Performance
| Metric | Waaree Renewable Technologies |
| Order book | 2.83 GWp |
| FY26 revenue growth YoY | 108.5% |
| FY26 PAT growth YoY | 109.1% |
| RoCE | 83.6% |
| RoE | 68.9% |
| EV/EBITDA | 14.7x |
Waaree Renewable Technologies reported a sharp rise in FY26 earnings, helped by faster project execution and strong demand for solar engineering, procurement and construction (EPC) work. For the full year, revenue grew 108.5% to Rs 3,331.4 crore, while PAT increased 109.1% to Rs 478.7 crore.
The company fits the capital-efficiency theme because the growth has come with high return ratios. Its RoCE stood at 83.6%, while RoE was 68.9%. This is strong for an EPC-led business. The company has scaled execution without a heavy balance sheet burden.
Execution Economics: Translating a 2.83 GWp Backlog Without Balance Sheet Stress
Growth visibility is supported by its order book. Waaree executed 2.73 GWp of projects in FY26, its highest-ever annual execution. At the end of the year, the unexecuted order book stood at 2.83 GWp. Management said this provides visibility for the next few quarters. It is also chasing a larger pipeline of around 36 GW, including about 23 GW from domestic markets and 12 GW from international opportunities. The company’s 3-year sales CAGR stood at 112%, while 3-year profit CAGR was 105%.
Beyond Solar EPC: Scaling O&M Infrastructure and Internal Accrual IPP Assets
The company is mainly a solar EPC player, with O&M and IPP as additional revenue streams. Its O&M portfolio stood at 1.18 GWp at the end of FY26. On the IPP side, it had 54 MW of operational solar assets and is setting up over 200 MW more. Management said the independent power producer (IPP) assets are being funded through internal accruals so far. The aim is to create steady revenue, while EPC remains the main business.
Waaree is also looking at battery energy storage system EPC as a new opportunity. Management said BESS is becoming important for grid stability and is now appearing in more renewable tenders. The company is executing a small BESS project and expects this revenue stream to open up during FY27. It is not yet executing overseas EPC projects, but said it is pursuing international opportunities.
Valuation is still reasonable compared with its own history. The stock trades at an EV/EBITDA of 14.7 times, below its 5-year average of 20.4 times and close to the peer average of 16.2 times. The key monitor will be order inflow. The order book has held up despite record execution, but fresh wins will be needed to sustain the current growth pace.
Waaree’s case is not just about high RoCE. It has also shown strong sales growth, profit growth and cash generation. The company benefits from India’s solar capacity push a theme also visible in an article we recently wrote on niche solar equipment stocks compounding sales over 75%, and its own execution track record. The risk is that EPC margins can move with project mix and competition. Still, its order book, O&M base and entry into BESS give the business more visibility than a regular high-return company.
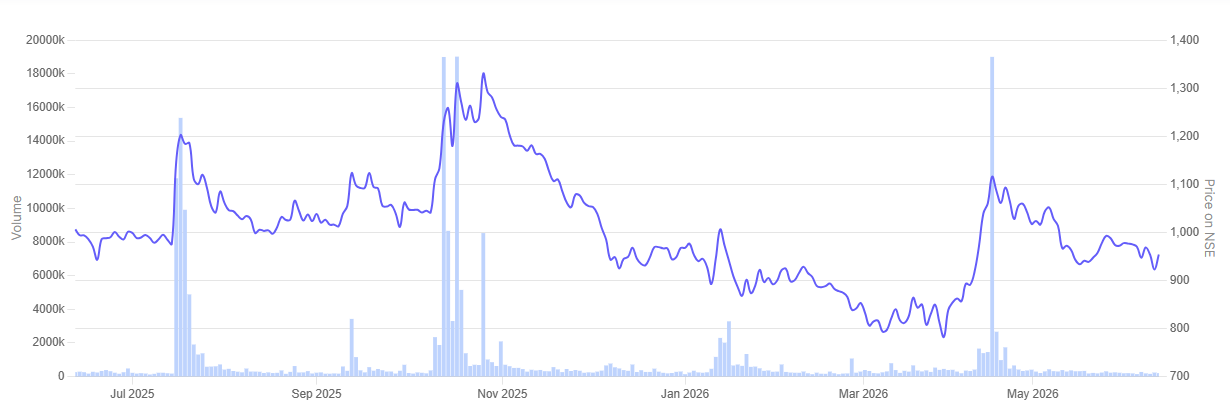
In the past year, the share price of Waaree Renewable Technologies is down 5.1%.
Waaree Renewable Technologies 1 Year Share Price Chart
#3 GE Vernova T&D India: Translating a ₹21,460 Crore Transmission Backlog Into Debt-Free Cash Conversion
GE Vernova T&D India is the listed entity of GE’s Grid Solutions business in India. It has been in the power transmission and distribution business for more than 100 years and provides a versatile range of solutions for connecting and evacuating power from generation sources onto the grid.
GE Vernova TD India Financial Performance
| Metric | GE Vernova T&D India |
| Order backlog | Rs 21,460 crore |
| FY26 revenue growth YoY | 45% |
| FY26 PAT growth YoY | 103% |
| RoCE | 76.4% |
| RoE | 57.3% |
| EV/EBITDA | 68.1x |
GE Vernova T&D India reported a strong FY26, helped by record order inflows, better execution and rising demand for power transmission equipment. For FY26, revenue rose 45% to Rs 6,210 crore. Net profit also improved sharply, rising to Rs 1,233 crore an increase of about 103%.
Financial Turnaround Mechanics: Turning a High-Voltage Transmission Cycle Into ₹2,500 Cr Cash
The company stands out in the capital-efficiency screen because profitability has improved without balance sheet stress. RoCE stood at 76.4%, while RoE was 57.3%. The balance sheet is also debt-free, with cash and cash equivalents of Rs 2,500 crore as of March 2026. Management said the company generated Rs 1,580 crore of cash during FY26.
Growth visibility is strong. New orders stood at Rs 14,776 crore for FY26, while the order backlog reached Rs 21,460 crore as of March 2026. The backlog was up 49% from the previous year. Management said orders continued to outpace revenue, giving the company multi-year visibility. The backlog also includes long-cycle HVDC projects, which should start contributing more meaningfully from FY29.
The company is benefiting from India’s grid investment cycle. Renewable capacity addition, industrial demand, data centres and long-distance power evacuation are increasing the need for stronger transmission infrastructure. GE Vernova T&D’s portfolio covers high-voltage transmission equipment, grid solutions, digital systems and HVDC technology. Management also said its products are supplied to more than 60 countries, under its “India for the World” strategy.
GE Vernova T&D is also expanding capacity. During FY26, it initiated capital investment of more than Rs 1,000 crore across product lines and facilities. The board also approved Rs 55 crore of investment for new capacity in disconnectors and drives at Vallam, Tamil Nadu. Management said this will support both domestic demand and global supply opportunities.
Structural Risk De-Risking: Eliminating Utility Delays by Slashing State Exposure Below 2%
Execution also improved during the year. The company commissioned substations and transmission equipment for customers including ReNew, PGCIL, NTPC and HPPTCL. It also highlighted better project execution, improved customer mix and lower exposure to state utilities. State utility exposure is now below 2% of backlog, which should help cash conversion and reduce execution risk.
The stock, however, trades at a rich valuation. Its EV/EBITDA is 68.1 times, above its 5-year average of 54 times and well above the peer average of 23.7 times. That makes execution and order conversion important from here.
GE Vernova T&D is not just a high-RoCE company. It is also seeing strong order growth, rising profitability and better cash generation. The opportunity is supported by India’s long power transmission cycle and export demand. The risk is valuation. At current multiples, the market is already pricing in a large part of the growth story.
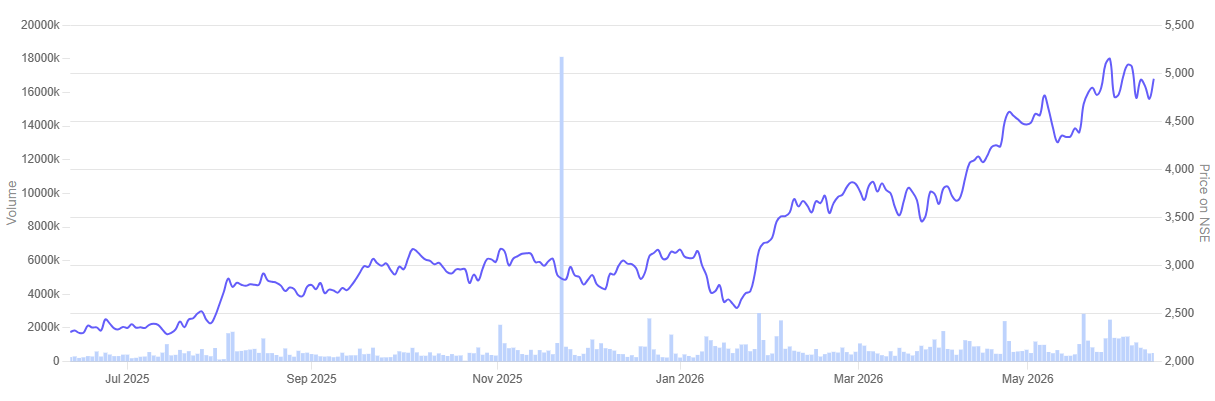
In the past year, the share price of GE Vernova T&D India is down 5.1%.
GE Vernova T&D India 1 Year Share Price Chart
Conclusion
High RoCE is a good starting point. But it cannot be the only reason to like a company. Some businesses look efficient because they do not need to invest much anymore. That can also mean growth has slowed.
So the better question is simple. Are these companies using capital well and still growing? In this list, the answer comes from sales growth, profit growth and cash flows. These numbers help separate genuine compounders from businesses that are only sitting on old strengths.
The filter is not a final verdict. Valuation still matters. So do order wins, execution and industry demand. But companies that can grow without stretching their balance sheets are worth tracking closely. They usually have more room to reinvest, protect margins and create value over time.
India’s Capital Efficiency Kings: Growth vs Returns vs Valuation
| Metric | Tips Music | Waaree Renewable Technologies | GE Vernova T&D India |
| FY26 revenue growth | 21% | 108.5% | 45% |
| FY26 profit growth | 30% | 109.1% | 103% |
| 3-year sales CAGR | 26% | 112% | 31% |
| 3-year profit CAGR | 42% | 105% | 490% |
| RoCE | 122% | 83.6% | 76.4% |
| RoE | 92.3% | 68.9% | 57.3% |
| Cash flow marker | Strong asset-light cash generation | CFO Rs 287 cr; FCF Rs 164 cr | Cash surplus Rs 2,500 cr; zero debt |
| Growth visibility | Music catalogue monetisation | 2.83 GWp order book | Rs 21,460 cr order backlog |
| EV/EBITDA | 27.9x | 14.7x | 68.1x |
| 5-year EV/EBITDA | 29.3x | 20.4x | 54x |
| Key theme | Asset-light music rights monetisation | Solar EPC order conversion | Power transmission capex cycle |
For now, the capital-efficiency theme looks strong. These companies are not just generating high RoCE, but are also showing growth, cash generation and business visibility.
The test from here will be execution. Tips must keep monetising its catalogue, Waaree must convert orders into revenue, and GE Vernova must deliver on its large backlog.
You can track how these are progressing by adding stocks to your watchlist.
Disclaimer:
Note: We have relied on data from www.Screener.in throughout this article. Only in cases where the data was not available, have we used an alternate, but widely used and accepted source of information.
The purpose of this article is only to share interesting charts, data points and thought-provoking opinions. It is NOT a recommendation. If you wish to consider an investment, you are strongly advised to consult your advisor. This article is strictly for educative purposes only.
Ekta Sonecha Desai has a passion for writing and a deep interest in the equity markets. Combined with an analytical approach, she likes to deep dive into the world of companies, studying their performance, and uncovering insights that bring value to her readers.
Disclosure: The writer and her dependents do not hold the stocks discussed in this article.
The website managers, its employee(s), and contributors/writers/authors of articles have or may have an outstanding buy or sell position or holding in the securities, options on securities or other related investments of issuers and/or companies discussed therein. The content of the articles and the interpretation of data are solely the personal views of the contributors/ writers/authors. Investors must make their own investment decisions based on their specific objectives, resources and only after consulting such independent advisors as may be necessary.


