

Artificial intelligence has an awkward secret. It is extremely thirsty for power. A single query to a large AI model can use several times the electricity of a plain web search. Now multiply that by millions of users and a fresh wave of data centres, and you get a demand curve that does not care whether the sun is up or down.
That last bit is India’s real headache. The country has built a huge amount of solar power, which is wonderful at noon but not of much help in the dark. Data centres are not so flexible. They need steady, round-the-clock power, 365 days a year. The gap between a sunny afternoon and a dark, busy evening is exactly where India’s clean-energy story runs into a wall.
The government’s answer landed in the 2025-26 Union Budget. It is called the Nuclear Energy Mission for Viksit Bharat, and it sets aside Rs 20,000 cr for small modular reactors, with a target of at least five home-grown reactors running by 2033. India wants to lift nuclear capacity from about 8,180 MW today to 22,480 MW by 2031-32, on the way to 100 GW by 2047.
The first two units, a 200 MW reactor and a 55 MW one, are planned at Tarapur near Mumbai. The law is being changed to let private firms in. But reactors are not written in code. They are built from metal by a handful of firms with rare skills and years of certification. Here are two companies that are catching the attention of smart investors.
MTAR Technologies: The High-Valuation Precision Moat
Incorporated in 1970, MTAR Technologies is one of the top three suppliers of precision-engineered parts to India’s civil nuclear, space and defence programmes. It makes the fiddly, safety-critical pieces that sit inside a reactor, such as fuel machines, drive mechanisms and grid plates, along with clean-energy parts like fuel-cell hot boxes and electrolysers.
You cannot order these from a random workshop. The certification alone takes years, and that wait is the company’s real moat. In April 2026 it even bagged a small export order for data-centre products, a neat sign of where demand is heading.
With a market cap of Rs 21,780 cr, the company’s civil nuclear power portfolio includes fuelling machine heads, bridge and column assemblies, grid plates, coolant channel assemblies, control plugs, hatch cover beams, and water-lubricated bearings.
The Shareholder Alignment Split: FII Inflows vs. Promoter Exits
One number on screener’s shareholding tab stands out. Foreign institutional investors (FII) held 6.74% of MTAR in March 2025. By March 2026 that had nearly tripled to 17.31%. Domestic institutional investors (DII) hold close to another 28%. So, the quiet accumulation story has some truth to it; the institutions have been buying.
The promoters, though, have gone the other way, trimming their stake from above 50% at the time of listing to about 30% now. When the people who run the company keep selling into a rising price, it is worth a pause and analysis.
Let us look at the financials of the company to see if it has what it will take to be a strong contender in India’s Nuclear ambitions.
| Financial Year | FY21 | FY22 | FY23 | FY24 | FY25 | FY26 | 5-yr CAGR |
| Sales (Rs Cr) | 246 | 322 | 574 | 581 | 676 | 876 | 29% |
| EBITDA (Rs Cr) | 83 | 94 | 154 | 113 | 121 | 171 | 16% |
| Net Profit (Rs Cr) | 46 | 61 | 103 | 56 | 53 | 94 | 15% |
The sales of the company grew from Rs 246 cr in FY21 to Rs 876 cr in FY26, a compound rate of about 29% over five years. EBITDA (earnings before interest, taxes, depreciation and amortisation) jumped from Rs 83 cr to Rs 171 cr, roughly 16% a year on a compounded basis. Net profit climbed from Rs 46 cr to Rs 94 cr, around 15% a year, and that is the soft spot. Profit actually slipped in FY24 and FY25 as margins thinned. But FY26 was the turnaround point as the company regained the momentum.
On capital efficiency front, MTAR earns a return on capital employed (ROCE) of about 15% which is same as the current industry median. In plain words, for every Rs 100 of capital the company puts to work, it generates a profit of roughly Rs 15 on it. Its return on equity is about 13%. Both are respectable, but they are nowhere near the 20%-plus figures the business posted in its better years, and that matters for the price you are about to see.
A 600% Growth Riddled by Astronomical Valuation
The share price of MTAR was about Rs 970 when listed in March 2021, and of closing on 1st June 2026 it was Rs 7,070, which is a jump of about 628% in 5 years. Rs 1 lac invested in the stock at listing 5 years ago would have been about Rs 7.3 lacs today. In fact, just in the last 1 year, the stock has seen a jump of almost 330%.
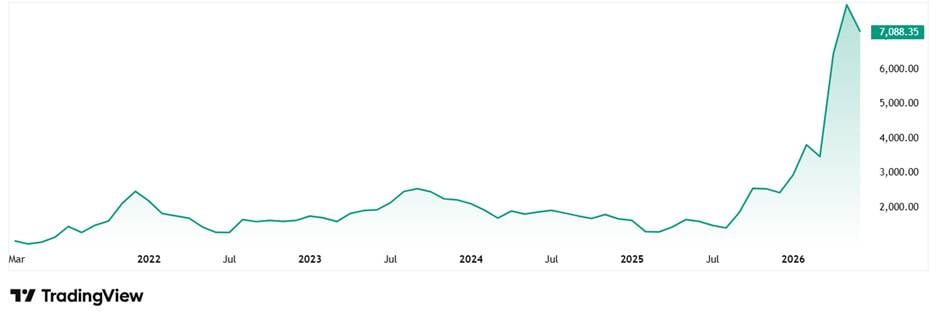
Regarding valuation, MTAR now trades at a P/E ratio of about 225 times, against an industry median of roughly 58x. The company listed only in March 2021, so it does not yet have a ten-year trading record. But even over its short life the PE has averaged near 90 times, and today’s 225 sits far above that.
A PE of 225 means you are paying Rs 225 for every Rs 1 the firm earns today. The business is genuinely good. But at this price, almost everything has to go right. The market is possibly pricing in India’s Nuclear growth already.
As per the most recent investor presentation from May 2026, the company had an order book of about Rs 2,582 cr and over 26% of it was from its Civil Nuclear Power wing.
ISGEC Heavy Engineering: ₹7,984 r Order Book Facing Severe Margin Compression
Established in 1933, ISGEC Heavy Engineering is big, sprawling and deeply unglamorous. It builds process-plant equipment, presses, castings and boiler parts, runs large turnkey projects for power and sugar plants, and even makes sugar and ethanol through a subsidiary.
With a market cap of Rs 6,681 cr, about 86% of the company’s revenue comes from engineering products and projects. Within that, it fabricates the heavy hardware, such as pressure vessels, heat exchangers and boiler pressure parts, that nuclear work demands. To keep up, the board has cleared fresh capex, including Rs 218 cr to expand its machine-building division and Rs 110 cr for a process-skids facility at the Dahej special economic zone.
Stagnant Sales, Volatile Earnings: Mapping the Underlying Margin Pressure
ISGEC’s financials seem a bit worrying at the first look.
| Financial Year | FY21 | FY22 | FY23 | FY24 | FY25 | FY26 | 5-yr CAGR |
| Sales (Rs Cr) | 5,426 | 5,499 | 6,399 | 6,218 | 6,422 | 6,789 | 5% |
| EBITDA (Rs Cr) | 469 | 335 | 473 | 548 | 598 | 555 | 3% |
| Net Profit (Rs Cr) | 253 | 115 | 206 | 255 | 264 | 154 | -9% |
Its sales have moved in an unimpressive fashion from Rs 5,426 cr in FY21 to Rs 6,789 cr in FY26, a compound rate of just 5% over five years. EBITDA also shows a small growth of just 3% in the same period from Rs 469 cr to Rs 555 cr. The Net profit is where things get messier. The profits have in fact slipped by over 9% on a compounded rate between FY21 and FY26.
While the company saw a slow but steady growth in profits till FY25, FY26 profits saw a huge drop.
ISGEC’s return on capital employed is about 11% against the current industry median of 15%. So, for every Rs 100 of capital it uses, it makes roughly Rs 11 of operating profit. There is one real blemish, and it is an old one. The company waits a long time to get paid. Its debtor days run near 148, which means customers take about five months on average to settle bills. In lumpy project businesses this is fairly normal, but it locks up cash that could be working harder elsewhere.
Steady Promoter Base Amid a 46% Peak Price Correction
The share price of ISGEC was about Rs 580 in June 2021 and as of closing on 1st June 2026 it was Rs 906, which is over 56% jump in 5 years. At the current price, the stock is trading at a discount of about 46% from its all-time high of Rs 1,677.
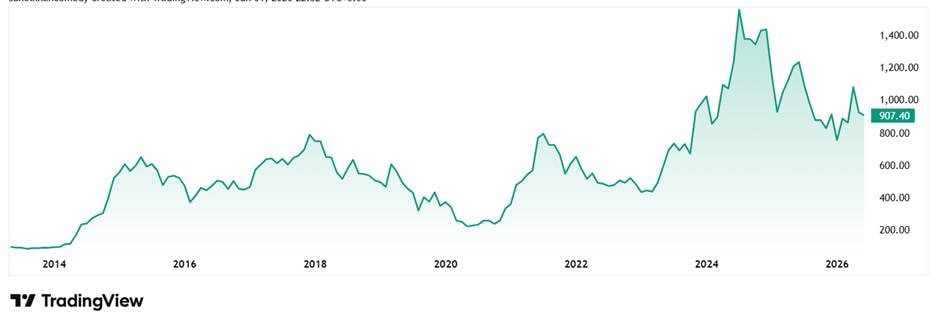
On valuation, ISGEC currently trades at a PE of about 58x while the industry median is about 17x. The 10-year median PE for ISGEC is about 24x and the industry median for the same period is 17x again.
So, it would not be wrong to say that it is sensibly priced against rivals, though not the deep bargain that excitable headlines like to claim. The reassuring part is the promoter holding, a rock-steady 62%. They have not sold a single share through all of this.
As per the May 2026 investor presentation, the company’s order book at the end of March 2026 stood at a robust Rs 7,984 cr. Also, in April 2026 the company bagged an order worth over RS 22 cr from NPCIL, which involves the design, manufacture, and supply of Doors, Door Frames, Accessories & Spares for the Main Air Lock (MAL) & Auxiliary Air Lock (AAL) for the Gorakhpur Haryana Anu Vidyut Pariyojana (GHAVP) Units 1 & 2.
Will the Order Pipeline Justify Today’s Extreme Multiples?
The idea behind both stocks is sound, and, importantly, it is backed by hard policy money. AI needs power that never sleeps. Solar sleeps every night. Nuclear does not. India has put Rs 20,000 crore and a 2033 deadline behind small reactors, and somebody has to build the parts. MTAR makes the precise pieces that go inside the core. ISGEC makes the heavy shell that wraps around it. Between them, they sit on a genuine bottleneck in a supply chain the country cannot import its way out of.
But a great story and a great investment are not the same thing. The market has clearly read the same budget you have. MTAR, at 225 times earnings and after a six-fold run, has priced in years of flawless execution; there is very little room left for disappointment.
ISGEC is far cheaper and steadier, yet it is still a slow-growth giant betting that thin margins keep fattening. Both confirm that the theme is real and the order pipeline is building. It also whispers that the easy money may already have been made. The reactors will get built. Whether today’s share prices reward the people who build them is a separate question, and the homework on that one is yours.
Adding these stocks to a watchlist seems like a good idea.
Disclaimer
Note: We have relied on data from http://www.Screener.in and http://www.trendlyne.com throughout this article. Only in cases where the data was not available, have we used an alternate, but widely used and accepted source of information.
The purpose of this article is only to share interesting charts, data points and thought-provoking opinions. It is NOT a recommendation. If you wish to consider an investment, you are strongly advised to consult your advisor. This article is strictly for educative purposes only.
Suhel Khan has been a passionate follower of the markets for over a decade. During this period, he was an integral part of a leading Equity Research organisation based in Mumbai as the Head of Sales & Marketing. Presently, he is spending most of his time dissecting the investments and strategies of the Super Investors of India.
Disclosure: The writer and his dependents do not hold the stocks discussed in this article. The website managers, its employee(s), and contributors/writers/authors of articles have or may have an outstanding buy or sell position or holding in the securities, options on securities or other related investments of issuers and/or companies discussed therein. The content of the articles and the interpretation of data are solely the personal views of the contributors/writers/authors. Investors must make their own investment decisions based on their specific objectives, resources and only after consulting such independent advisors as may be necessary.


