

Markets don’t often go down in a smooth, orderly way. Instead, they often pull back with a chaotic energy that shakes the confidence of even the most experienced of participants.
In investing, it’s given that the best chances to make money don’t often come up in times when you feel safe. These things arise when investors are at their most negative.
We ran a scanner on the Nifty Midcap 150 Index to check the stocks have their Relative Strength Index (RSI) below the crucial 30 threshold on both daily and weekly charts.
The data highlighted three midcap stocks – Havells India, ICICI Prudential Life Insurance, and Crisil.
Let us analyse the charts of these three stocks, which are offering a probable opportunity to investors.
1. Havells India: Problems in a High-End Structure
For a long time, Havells India has been the preferred choice of investors who wanted to benefit from India’s move toward a more organised electrical goods and consumer durables market. But even the strongest growth stories have to go through a “cooling-off” period at some point.
Havells Weekly Chart
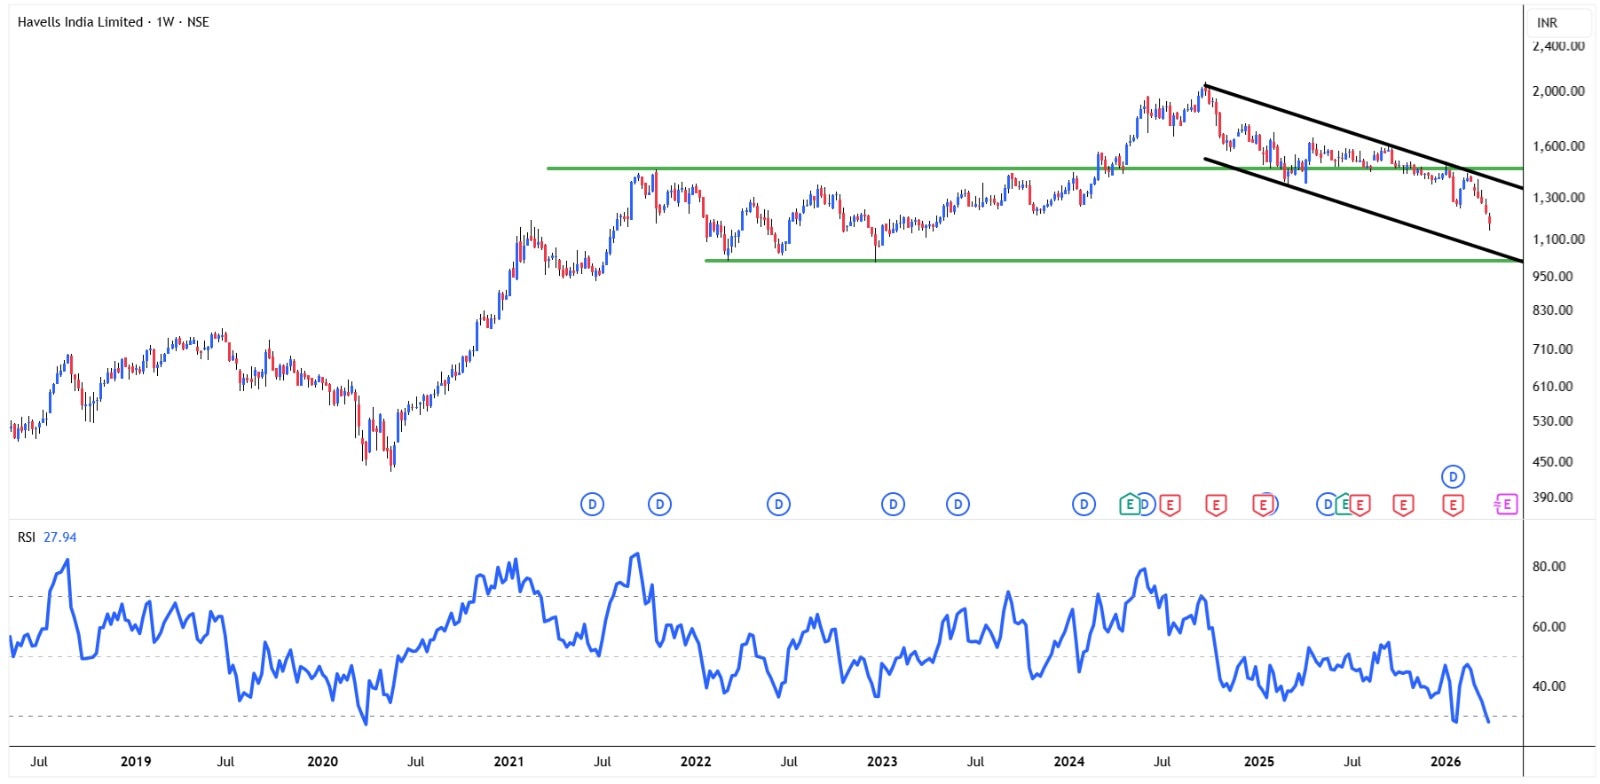
Havells has been moving through a “descending channel” on the weekly chart, which is a pattern with lower highs and lower lows. Short-term investors are almost in a panic because of this breach of the previous support line and the RSI dropping below 30.
But if you look at the bigger picture, there is a silver lining. The stock is currently going down toward a historical support zone near Rs 1,000 – 1,100. This a level that has been a strong base during earlier periods of of consolidation. In market psychology, these areas are the “collective memory” of all the buyers.
A “high-convexity zone” is when the RSI is very oversold and lines up with a major historical support level. Here, the possible upside is much greater than the immediate downside risk.
The strategic investor’s goal isn’t to “catch the falling knife” at the very bottom; it’s to know when the selling pressure has reached its limit compared to the company’s long-term earnings potential.
2. ICICI Prudential Life Insurance: The “Line in the Sand”
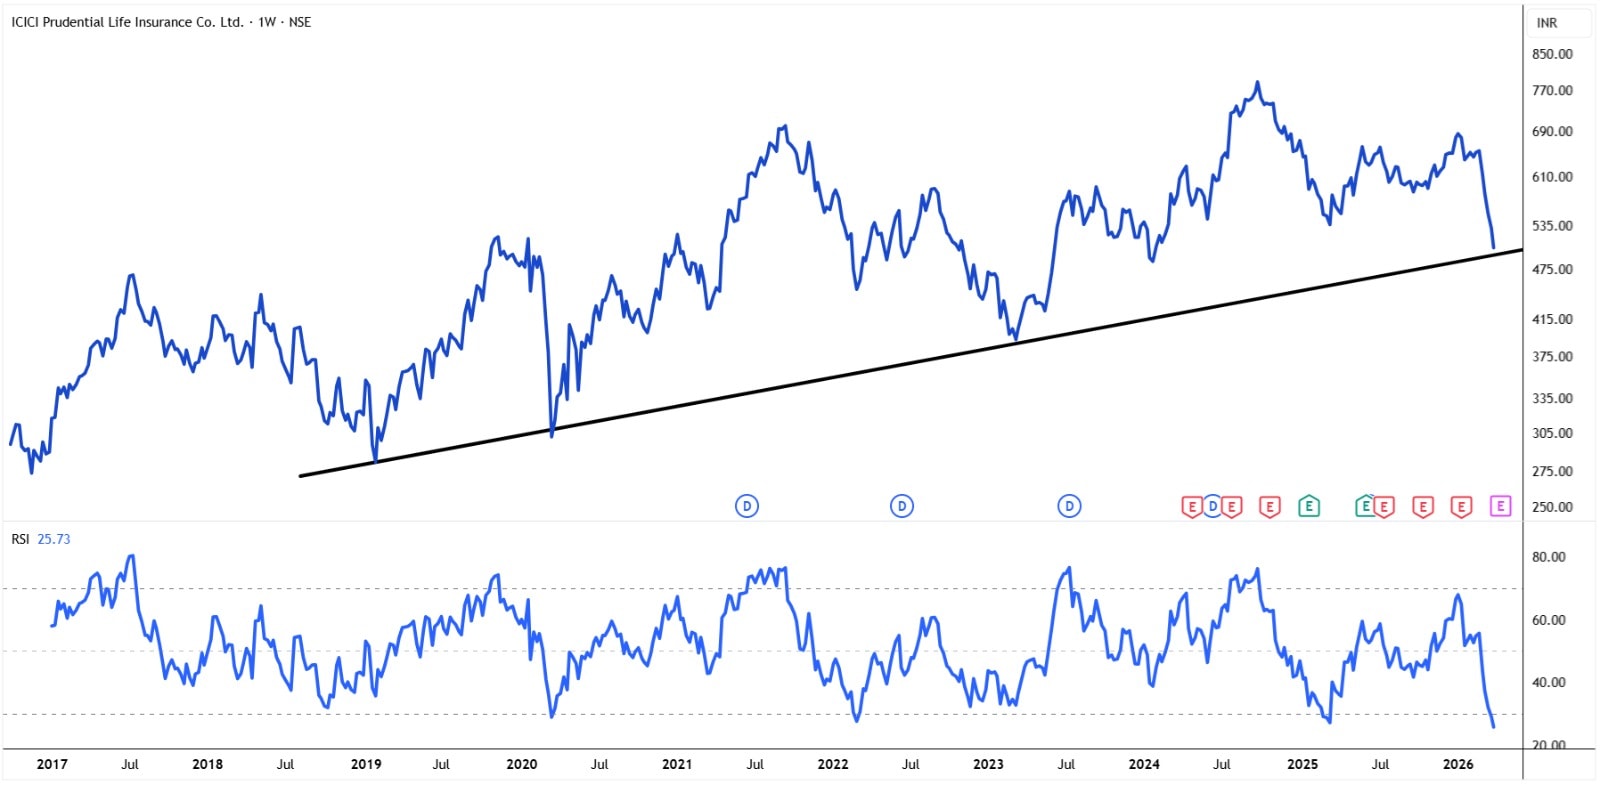
ICICI Prudential Life is at a very important technical crossroads right now. The stock is testing a long-term rising trendline that has been the primary support for its price for years.
The recent market correction has been so sharp that the RSI has dropped below 30. This could mean that the selling momentum is finally starting to run out.
This is a classic “line in the sand” moment. There are two main situations:
- The Rebound: The trendline stays the same as institutions buy the stock looking for value and short-covering causes a sharp mean-reversion rally.
- The Breakdown: The trendline doesn’t work, which means that there may be a bigger structural change that requires a full re-evaluation of the investment thesis.
In the past, when a long-term trendline and an oversold RSI came together, it was a good time for investors who value patience over the need to guess. It’s a very tense time, but it could also be a probable rewarding one.
3. CRISIL: The “Throwback” Reset
CRISIL’s chart is a perfect example of a market leader that needs to reset. The stock has been doing well for a long time, but now it’s in a corrective phase and is moving back toward a major support zone in the Rs 3,400–Rs 3,600 range.
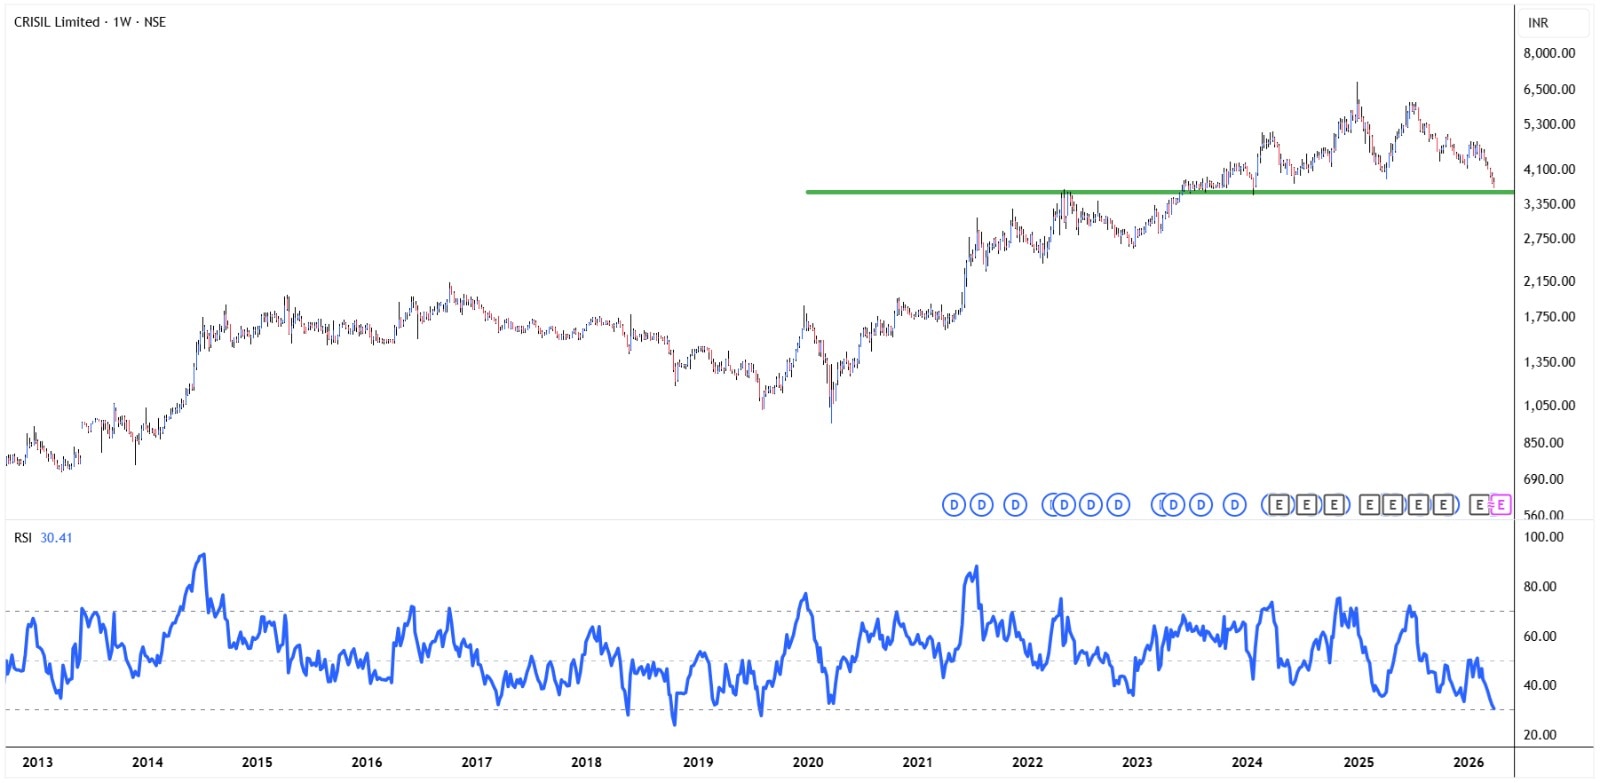
In the past, this level was a major “breakout region” in technical terms. A stock that goes back to a previous breakout point to see if it can hold up as new support is said to have “thrown back.”
These moves are very important because they get rid of “weak hands” and speculative froth, which lets the stock build a stronger base for its next rise.
The setup is potentially strong now that the RSI is flirting with oversold territory during this retest. If this support zone holds, it shows that the previous breakout was strong and sets the stage for a new upward trend.
The combination of a major structural retest and an oversold momentum indicator suggests that the current price may be close to a point of equilibrium, just like the other stocks on this list.
What Should Investors Do?
Even though the technical setups are interesting, “oversold” does not mean “automatic buy.” Markets can stay irrational and oversold for longer than a person can stay in business.
Every time the market goes down, it’s different. The news is louder, the talk on social media is scarier, and the fear feels more real.
A daily and weekly RSI below 30 is a mirror showing how worried everyone is. The next bull run will come from that fear. An investor’s most important question isn’t “How much lower can it go?”
Instead they should think – “Am I ready to do something when the selling stops?”
Disclaimer:
Note: The purpose of this article is only to share interesting charts, data points and thought-provoking opinions. It is NOT a recommendation. If you wish to consider an investment, you are strongly advised to consult your advisor. This article is strictly for educative purposes only.
Brijesh Bhatia is an Independent Research Analyst and is engaged in offering research and recommendation services with SEBI RA Number – INH000022075. He has two decades of experience in India’s financial markets as a trader and technical analyst.
Disclosure: The writer and his dependents do not hold the stocks discussed here.
The website managers, its employee(s), and contributors/writers/authors of articles have or may have an outstanding buy or sell position or holding in the securities, options on securities or other related investments of issuers and/or companies discussed therein. The content of the articles and the interpretation of data are solely the personal views of the contributors/ writers/authors. Investors must make their own investment decisions based on their specific objectives and resources, and only after consulting such independent advisors if necessary.


