

The Metal Sector Anomaly: Why Value Stocks are Mispriced
As the metal manufacturing industry giants bask in the spotlight of record-high valuations, a curious anomaly has emerged in India’s industrial heartlands. Most investors are aggressively chasing the heat of momentum, often blinded to the cold, hard reality of the balance sheet where genuine wealth is being mispriced in plain sight.
At the centre of this disconnect are two niche metal manufacturing stocks that are quietly generating double-digit profit growth while trading below their book value.
These firms are currently being valued at less than the sum of their assets, a rare occurrence in an otherwise expensive market. These are not distressed assets; they are cash-rich operations offering robust strong yields that effectively pay the shareholder to wait for a market rerating.
As investors start building their watchlists for FY27, these firms could be worthy contenders to make it to the list. Let us dive into the stocks to see if they are the next metal giants hiding in the bargain bin or merely cyclical traps.
Maithan Alloys: A Cash-Rich Profit Champion with a 1.9% Dividend Yield
Established as Maithan Steel & Castings Limited, Maithan Alloys was incorporated in 1985 and is engaged in the business of manufacturing and exporting of all three bulk Ferro alloys- Ferro Manganese, Silico Manganese and Ferro Silicon.
With a market cap of Rs 2,548 cr, the company is one of the largest domestic producers of manganese-based ferroalloys and it holds more than 5% of the market share of the total domestic ferro alloy industry. It is also engaged in the generation and supply of Wind Power and has a Captive Power Plant.
Maithan boasts of a current dividend yield of 1.9% in a flat market, as the industry median is 0%. Which means that for every Rs 100 invested, the company gives investors Rs 2 in dividends, while its peers still struggle to give out any.
Plus, the book value of the company is Rs 1,416 and its current price is Rs 875 (as on 27th March 2026). Book Value is essentially the net worth of a company according to its balance sheet. It represents the total value of a company’s assets that shareholders would theoretically receive if the company were liquidated today, meaning all assets were sold and all debts (liabilities) were paid off.
This valuation gap signifies that Maithan is currently trading at a Price-to-Book (P/B) ratio of approximately 0.62, representing a 38% discount to its accounting net worth. Such a discrepancy suggests either a pessimistic market outlook on future asset yields or a classic undervaluation where the company’s liquidation value exceeds its current market capitalization.
For the prudent investor, this creates a potential margin of safety allowing for the acquisition of tangible equity at significantly less than its replacement cost or recorded balance sheet value.
Financials & Valuations: The Math Behind the Magic
Let us look at the financials of the company to get a sense of where the company stands currently.
The sales of the company saw a downward slide in the last 5 years, which seemed to have bounced back in FY25.
| FY | FY20 | FY21 | FY22 | FY23 | FY24 | FY25 |
| Sales/Rs Cr | 1,816 | 1,615 | 2,989 | 2,883 | 1,726 | 1,802 |
For the 3 quarters of FY26 ending in December 2025, the company has logged sales of Rs 1,613 cr.
The EBITDA (earnings before interest, taxes, depreciation, and amortization) saw a bumpy ride in the last 5 years.
| FY | FY20 | FY21 | FY22 | FY23 | FY24 | FY25 |
| EBITDA/Rs Cr | 235 | 294 | 1,075 | 589 | 116 | 179 |
And for the 3 quarters of FY26 ending in December 2025, the company has logged an EBITDA of Rs 152 cr.
Net profit is an area where the company has shown it strengths, as it has logged a compound profit growth of 33% in the last 5 years.
| FY | FY20 | FY21 | FY22 | FY23 | FY24 | FY25 |
| Net Profits/Rs Cr | 222 | 230 | 818 | 499 | 349 | 631 |
And for the 3 quarters of FY26 ending in December 2025, the company has logged profits of Rs 512 cr.
The share prices of Maithan Alloys Ltd were around Rs 580 in March 2021 and as on 27th March 2026 it was Rs 880.
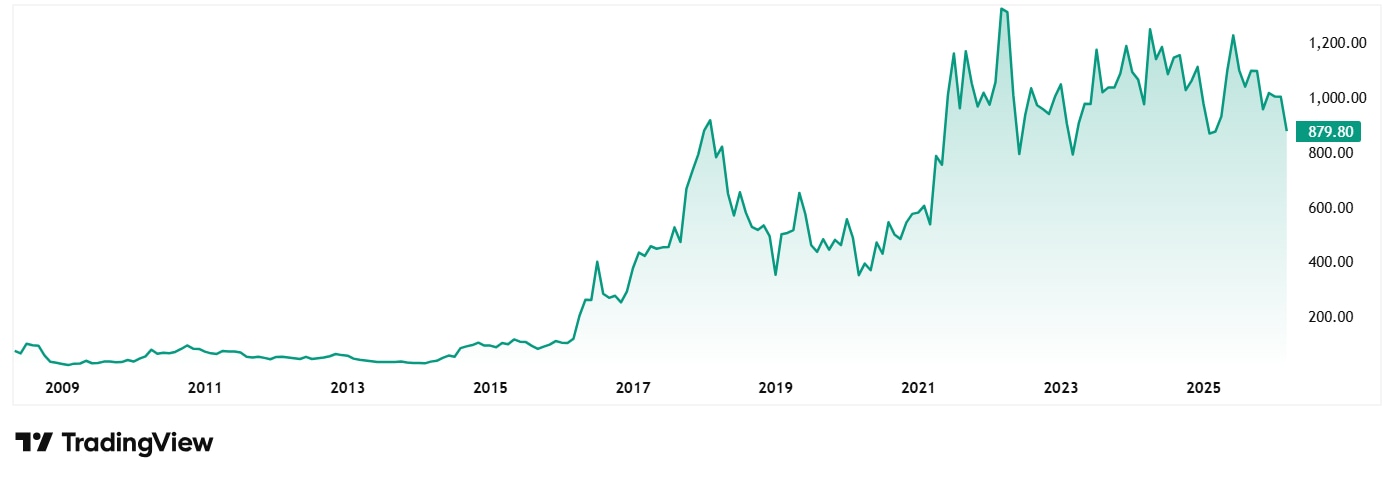
In the last 6 months, the stock price has corrected by 25% from around Rs 1,175 to its current Rs 880, which is closer to its 52-week low of Rs 834. This correction reflects a cyclical downturn in ferroalloy demand and a sharp 47% contraction in TTM net profit.
The market is discounting the stock due to stagnant five-year sales growth and an increasing reliance on non-operational other income to mask operational weakness. Combined with rising interest costs, these factors have triggered a fundamental re-rating of the company’s core earning capacity.
As for valuations, the company’s current PE is 6x, while the current industry median is 15x. Which means that the stock is significantly undervalued and offers a strong margin of safety for investors betting on a recovery in profits. If the stock simply returns to industry-standard pricing, there is substantial room for a major price re-rating.
Prakash Industries Ltd – The Asset-Heavy Play Trading at 0.6x Book Value
Established as Prakash Pipes and Industries Limited in 1980, Prakash Industries Limited is engaged in the business of manufacturing and sale of Steel Products and generation of Power.
With a market cap of Rs 2,115 cr, the company’s product portfolio includes sponge iron, steel billets, Ferro alloys, wire rods, HB wires, and TMT bars.
Like Maithan, Prakash Industries also has a current dividend yield of 1.3% in a flat market, which means that for every Rs 100 invested, the company gives investors Rs 1.3 in dividends, while its peers aren’t able to pay out any dividends.
The book value of the company is Rs, 191 and its current price is Rs 118 (as on 27th March 2026). In a sector where peers are struggling for liquidity, Prakash’s ability to sustain a 1.3% dividend yield while priced below liquidation value offers a significant margin of safety. Essentially, the market is currently pricing every Rs 1 of the company’s tangible industrial assets at just Rs 0.6, presenting a classic deep-value discrepancy.
Operational Momentum Meets Deep Value
Looking at the long-term financials of the company, the sales of the company logged a compound growth of 6% from Rs 2,974 cr in FY20 to Rs 4,014 cr in FY25. For the first 3 quarters of FY26 ending in December 2025, the company has logged sales of Rs 2,599 cr which means it is headed towards a much stronger end to FY26.
The EBITDA grew from Rs 350 cr in FY20 to Rs 520 cr in FY25, which is a compounded growth of 8%. And for the 3 quarters of FY26 ending in December 2025, EBITDA of Rs 370 cr has been recorded.
Regarding Net profits, Prakash Industries has logged a compound growth of 25% in the last 5 years, from Rs 118 cr in FY20 to Rs 355 cr in FY25. And for the 3 quarters of FY26 ending in December 2025 profits of Rs 240 cr have been logged.
The share prices of Prakash Industries Ltd were around Rs 81 in March 2021 and as on 27th March 2026 it was Rs 118.
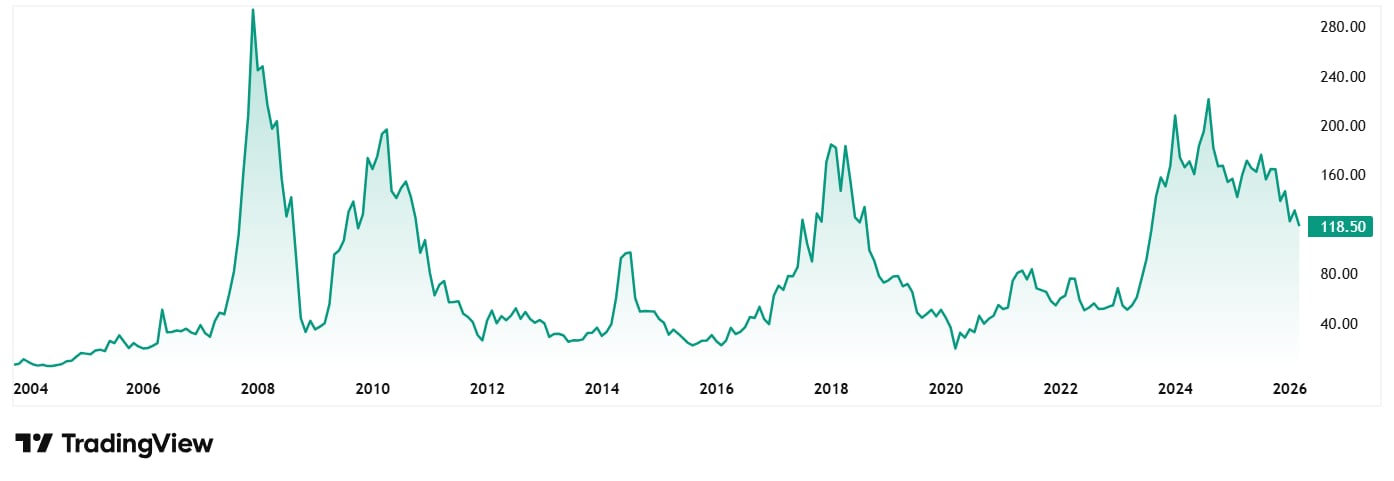
In the last 6 months, the stock price has corrected by over 30% from around Rs 170 to its current Rs 118, pushing it closer to its 52-week low of Rs 110.
This correction reflects a broader de-rating of the stock as the market adjusts for cyclical headwinds in the steel sector and a modest 8% EBITDA CAGR over the last five years. Despite an upgraded credit rating in early 2026, the equity is currently being priced as a deep-value play, trading significantly below its book value of ₹191.
As for valuations, the company’s current PE is 6x, while the current industry median is 19x, which means that while the broader sector commands Rs 19 for every rupee of profit, Prakash Industries is being valued at just Rs 6.
This suggests that investors are either pricing in a significant risk premium or fundamentally overlooking the company’s earnings durability. For a value-oriented investor, this represents a substantial valuation delta that often signals a mispriced asset relative to its peer group.
Are These Deep Value Plays Ready for a Re-Rating?
The Indian market sometimes acts like a teenager chasing the latest fashion trend, ignoring the sturdy, well-tailored suits in the back of the closet. For Maithan Alloys and Prakash Industries, the current price tags suggest a buy one, get half-off sale on actual, physical assets. While most investors are hunting for momentum at record-high valuations, these two niche metal manufacturing stocks offer a floor made of cash and industrial equity.
However, the market’s caution isn’t entirely baseless. A stagnant top-line growth and cyclical fears have pushed these stocks into the bargain bin. Yet, with double-digit profit growth and consistent dividends, the value trap label feels increasingly out of place. As we look toward to FY27, the massive gap between their market price and their accounting book value will either close through a sharp rally or remain a curious monument to market inefficiency.
A smart way to not miss out on any big movements in these stocks is to add them to a watchlist and keep a vigilant eye on them.
Disclaimer:
Note: We have relied on data from www.Screener.in and www.trendlyne.com throughout this article. Only in cases where the data was not available, have we used an alternate, but widely used and accepted source of information.
The purpose of this article is only to share interesting charts, data points and thought-provoking opinions. It is NOT a recommendation. If you wish to consider an investment, you are strongly advised to consult your advisor. This article is strictly for educative purposes only.
Suhel Khan has been a passionate follower of the markets for over a decade. During this period, He was an integral part of a leading Equity Research organisation based in Mumbai as the Head of Sales & Marketing. Presently, he is spending most of his time dissecting the investments and strategies of the Super Investors of India.
Disclosure: The writer and his dependents do not hold the stocks discussed in this article.
The website managers, its employee(s), and contributors/writers/authors of articles have or may have an outstanding buy or sell position or holding in the securities, options on securities or other related investments of issuers and/or companies discussed therein. The content of the articles and the interpretation of data are solely the personal views of the contributors/ writers/authors. Investors must make their own investment decisions based on their specific objectives, resources and only after consulting such independent advisors as may be necessary.


