

As the country’s economy expands and household financial savings deepen, the pool of investable wealth is growing at a pace that could reshape the industry.
According to the latest report (The Great Reordering) by the Boston Consulting Group (BCG), India is expected to add more than $2 trillion in financial wealth by 2030, the highest among emerging markets.
Furthermore, this wealth is highly concentrated. According to Motilal Oswal Private Wealth, about 229 individuals collectively control $1 trillion in wealth. Moreover, according to the Knight Frank Wealth Report 2026, the number of billionaires in India is projected to increase by 51%.
For wealth management firms, this is more than a macro trend. It points to a growing base of affluent and high-net-worth individuals seeking investment advice, portfolio diversification, and financial planning, opening up a long runway for growth.
Against this backdrop, this article covers three leading wealth management firms positioned to benefit from India’s rising wealth and growing appetite for financial products.
Before we dig in, here’s a snapshot:
India’s Top Wealth Managers at a Glance (FY26)
| Company | AUM (₹ Cr) | YoY AUM Growth | FY26 Revenue (₹ Cr) | FY26 Profit (₹ Cr) |
| 360 ONE | 6,74,492 | 16% | 3,066 | 1,225 |
| Nuvama | 4,52,548 | 5% | 3,122 | 986 |
| Motilal Oswal PWM | 1,96,716 | 36% | 1,080* | NA* |
| Combined | 13,23,756 | – | – | – |
Now dive into each of these companies and understand what is driving their business and what to expect in the years to come.
#1 Inside 360 ONE’s ₹6.7 Lakh Crore Moat
360 ONE WAM is one of India’s leading integrated wealth and alternative asset management firms. It provides a comprehensive suite of financial services to Ultra High Net Worth Individuals (UHNIs), High Net Worth Individuals (HNIs), family offices, mass-affluent retail investors, and corporate institutions.
The Structural Shift: Deconstructing the ₹6.74 Lakh Crore Asset Mix
As of 31 March, 2026, the firm’s overall Assets Under Management grew by 16% year-on-year to reach a record high of ₹6,74,492 crore. Of the total AUM, Wealth Management stands at ₹5,79,286 crore (up 16.5% YoY), and Asset Management (Alternative Funds, Mutual Funds, and Discretionary Portfolio Management Services) stands at ₹95,206 crore (up 12.8% YoY).
The Moat: Recurring Revenue vs Transactional Churn
It places a strong emphasis on cultivating high-quality, predictable revenue streams, which also constitute its distinct competitive edge (moat). Out of the total AUM, Annual Recurring Revenue (ARR) AUM stands at ₹3,11,940 crore. Consequently, ARR AUM constitutes approximately 46.2% of the total AUM.
The remaining balance of ₹3,62,552 crore comes from Transactional / Brokerage (TBR) AUM. A larger share of ARR provides the company with a predictable and stable revenue base. This is evident from the revenue mix. In FY26, its revenue grew by 25.4% year-on-year to ₹3,066 crore.
The revenue mix is skewed towards recurring, predictable income. In FY26, revenue from ARR grew by 34.5% to ₹2,289 crore. ARR is the largest contributor to the company’s financial results, accounting for 74.65% of revenue. The remaining revenue (₹777 crore) came from TBR.
Record Profits and Operational Efficiency
Despite a volatile equity market, 360 One reported its highest-ever full-year net profit of ₹1,225 crore, up by 20.7% YoY. Operating profit before tax grew by 22% to ₹1,498 crore. This translates to a robust Operating Profit Margin of approximately 48.8%.
Roadmap 2026-2030: Target Metrics and Scalability
Looking ahead, management is optimistic about the firm’s growth trajectory over the next 3 to 5 years. The firm aims to grow Wealth Management AUM by 20-25% annually and profits by 15-25% annually.
To achieve this AUM growth, the company aims to get 12-15% of its opening AUM as net new flows each year. Management also expects a 10-14% growth from mark-to-market performance. It plans to improve its cost-to-income ratio from 49.9% down to 46-48% over the next 2-3 years.
This will be driven by operational leverage, scaling of core businesses, and new strategic initiatives (like ET Money) that turn profitable. Currently, it holds an estimated 8-10% market share in wealth management. It intends to double its market share over the next 3–5 years by doubling the UHNI client base from 4,500 families to 8,000-10,000 families.
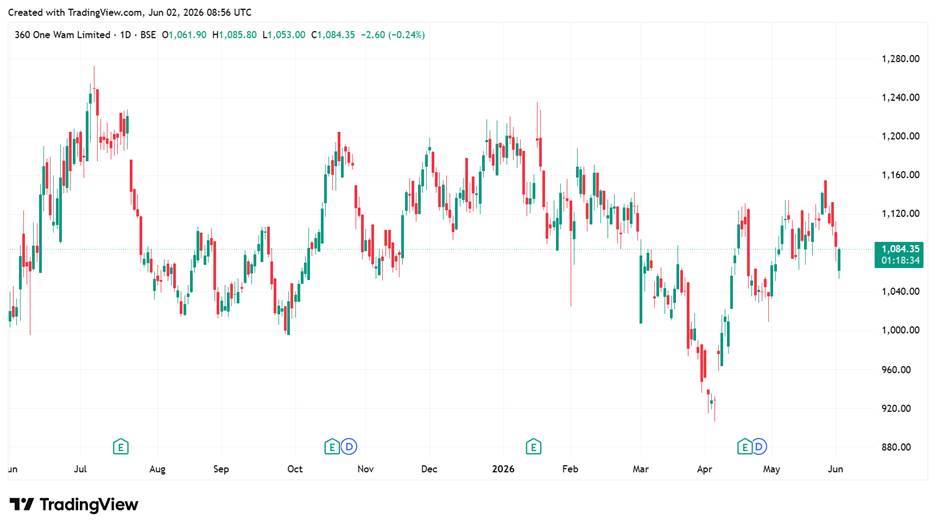
360 One Share Price
#2 Nuvama Dominates Beyond Tier-1 Cities
Nuvama Wealth offers wealth management solutions to UHNIs and Family Offices, HNI and Affluent Individuals, and Corporations and Institutions. As of 31 March FY26, it manages assets of ₹4,52,548 crore, up 5% YoY.
Breaking Down Nuvama’s ₹4.52 Lakh Crore Asset Matrix
Nuvama private (UHNI segment) AUM grew by 4% to ₹2,06,677 crore. This is followed by Nuvama Wealth (HNI), whose AUM increased by 14% to ₹1,07,110 crore. The remaining asset comprises Asset Management (₹12,807 crore) and Asset Services (Custody & Clearing) at ₹1,25,954 crore.
We will discuss wealth and private business separately below.
Geographic Alpha: The MPIS Engine and Non-Metropolitan Scaling
Nuvama Wealth boasts a wide geographical presence, covering over 500 locations in India, with roughly 35% to 40% of its business originating from beyond Tier 1 and Tier 2 cities. Managed Products and Investment Solutions (MPIS) is the segment’s primary growth driver, contributing to nearly all of its revenue growth.
MPIS revenues grew 38% YoY, increasing its share of total wealth revenues to 59% (up from 50% in FY25). MPIS assets grew 32% to ₹39,227 crore, driven by a 38% increase in net new money to ₹8,920 crore. About 60% of MPIS revenue is annuity-based, while 40% is transaction-based.
The company has recently expanded its team of relationship managers (RM), and the results are now evident. Nuvama Wealth achieved a 25% jump in revenue productivity per RM. To further deepen its relationship with HNI families, the firm launched “Virasat,” an estate/legacy planning solution.
From a financial perspective, the segment revenue grew by 18% YoY to ₹960 crore, while operating profit before tax (PBT) surged 22% YoY to ₹330 crore. The cost-to-income ratio improved by 135 basis points to 65.7% as RM productivity began to yield gains.
Premiumization: ARR Growth in Nuvama Private
On the other hand, Nuvama Private manages assets of more than 4,750 UHNI and family offices. Geographically, wealth density is concentrated, with the top 8 to 10 Indian cities accounting for 80% to 85% of business activity. The strategic focus of this segment is on high-quality ARR.
ARR-earning assets grew at an accelerated 22% YoY to ₹54,021 crore, supported by strong net new money flows of ₹9,630 crore. Consequently, ARR revenue surged by 32% and now accounts for 59% of the segment’s total revenue of ₹758 crore (up 24% YoY). The segment PBT grew by 24% to ₹256 crore.
Looking ahead, Nuvama has a stated five-year goal to grow its wealth clients and client assets by 2 to 2.5 times, targeting a 15% to 20% CAGR. To support this, it plans to continuously expand its geographical footprint and double its RM capacity over the next 3 to 5 years. It has also expanded its international presence in Dubai and Singapore to tap into the diversification trend.
Consolidated Performance Dragged by Capital Markets
From the consolidated financials, revenue grew by a modest 8% to ₹3,122 crore, due to muted performance by the capital market business. Net profit surged by a modest 6% to ₹986 crore as the cost-to-income ratio grew by 100 bps to 56% for FY26. The wealth business now accounts for a larger share of the firm’s total revenue (55%).
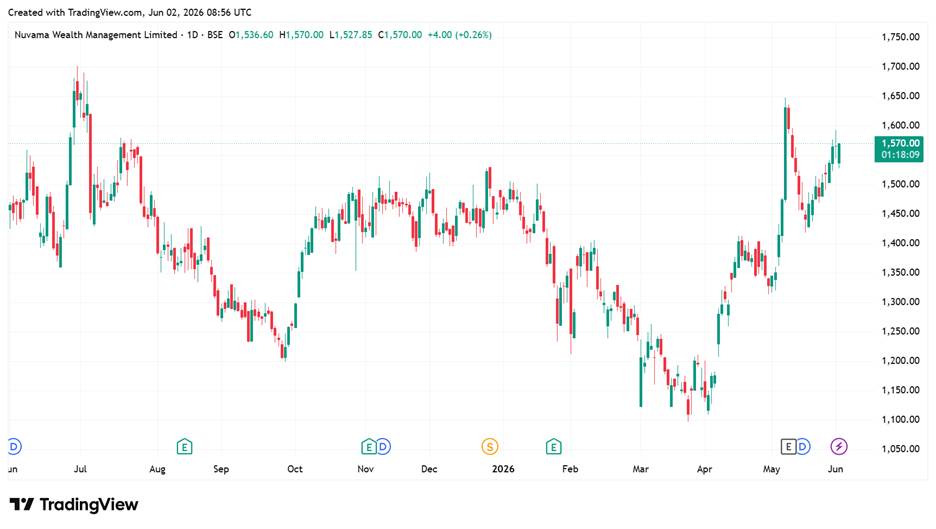
Nuvama Share Price
#3 Motilal Oswal’s High-Yield RM Engine
Motilal Oswal Financial Services (MOFSL) operates its wealth management business through two distinct segments: Private Wealth Management (PWM) and Wealth Management, which encompasses retail broking, capital market lending, and distribution.
Decoding Motilal Oswal’s ₹1.97 Lakh Crore Private Wealth Engine
PWM provides integrated platform solutions for wealthy clients across asset management, lending, investment banking, and institutional equities. The business caters specifically to HNIs (₹50-500 crore), UHNIs (over ₹500 crore), and Family Offices.
It works with over 9,100 associated families (with an AUM of ₹1 crore or more), including over 400 Hurun UHNI families, and manages an average AUM of ₹22 crore per family. This segment manages an AUM of ₹1,96,716 crore, up 36% YoY. A 41% YoY increase in net flows during FY26 supported the growth.
Operational Leverage: Scaling the RM Engine and Tier-2 Footprint
This segment also witnessed strong growth, with revenue growing by 17.4% to ₹1,080 crore in FY26. ARR accounts for 54.3% of revenue, growing 32.6% to ₹586 crore in FY26. The remaining revenue (₹494 crore) comes from TBR. Management aims to expand ARR and AUM (₹46,000 crore) to achieve more predictable revenue.
This will be achieved by offering comprehensive advisory solutions and bespoke transaction strategies, and by strengthening its lending and leverage solutions as a distinct value-add for UHNI clients. To fuel growth, MOFSL plans to recruit high-quality RMs throughout FY27.
Management views the productivity of its team as a leading indicator of success. AUM per RM has steadily increased from ₹300 crore a couple of years ago to around ₹450 crore currently, even on a higher RM base. This improvement and deeper penetration are expected to be the primary drivers of AUM growth going forward.
It is also expanding its physical footprint in Tier 2 locations where it anticipates high growth in the emerging HNI segment. Furthermore, the company notes that out of its current base of over 9,000 families, almost 50% possess UHNI potential. This provides an internal pipeline to scale the quality and size of client assets over time.
Consolidated Financials: Core Operations Face Treasury Loss Drag
From the consolidated financials viewpoint, operating net revenue grew by 14% YoY to ₹5,908 crore in FY26. In FY26, ARR accounted for 60% of total revenue (up from 54% in FY25), with TBR accounting for the remaining 40%.
However, net profit fell 18% to ₹2,043 crore due to a ₹317 crore loss in treasury investments. Excluding that, operating net profit was 16% higher at ₹2,360 crore.
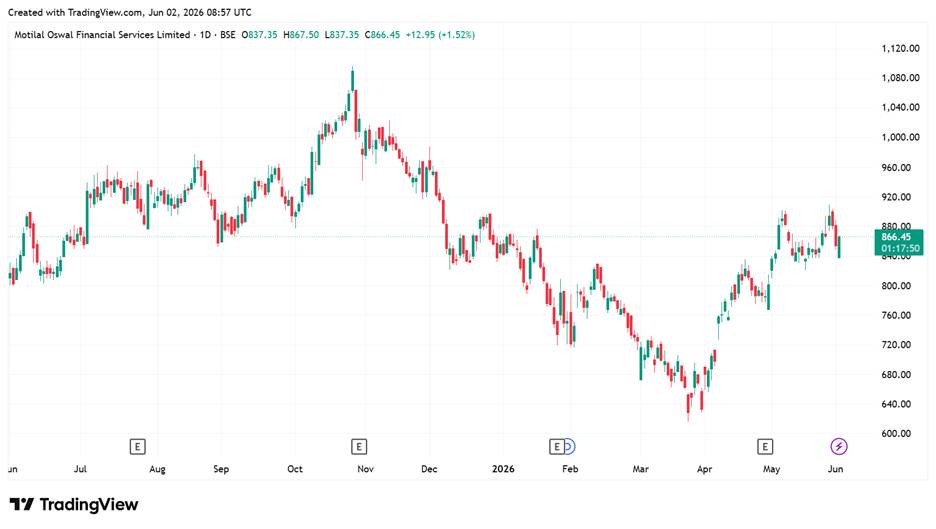
MOFSL Share Price
Who Has the Stickiest Revenue Base?
| Company | AUM (₹ Cr) | ARR AUM (₹ Cr) | ARR Revenue Share | Key Takeaway |
| 360 ONE | 6,74,492 | ₹3,11,940 | 74.6% | Highest recurring revenue mix |
| Nuvama Private | 2,06,677 | ₹54,021 | 59.0% | Fastest ARR growth |
| Motilal Oswal PWM | 1,96,716 | ₹46,000 | 54.3% | ARR mix improving steadily |
Evaluating Capital Efficiency: Premium Valuations vs Industry Medians
Nuvama stands out with strong Return on Capital Employed (ROCE) and Return on Equity (ROE), followed by Motilal Oswal. 360 One’s return ratios have been lower following last year’s equity dilution, which is expected to normalise over time.
360 One strongest moat is its high recurring revenue (see table above). This provides better earnings visibility and to some extent, it also explains why it trades at a relatively high multiple. On the other hand, Nuvama and MOFSL both continues to trade at a discount to 360 One.
This also suggests that as the contribution of ARR to their revenue increases, valuation multiples could cathcup with 360 One. Nonetheless, while 360 One is right now trading at in line with both the industry and its historical median, MOFSL and Nuvama continues to trade at premium.
| Particulars | Price-to-Earnings Multiple (X) | Return Ratios | ||
| Company | 3Y Median | ROCE (%) | ROE (%) | |
| 360 One | 35.6 | 36.5 | 12.1 | 14.4 |
| Nuvama | 27.1 | 25.8 | 17.5 | 27.4 |
| Motilal Oswal | 27.6 | 15.9 | 12.6 | 15.6 |
| Industry | 20.8 | 13.1 | 11.0 | |
India’s expanding financial wealth and rising affluent population are creating a larger opportunity set for wealth managers.
As investors increasingly seek portfolio diversification, advisory, and financial planning, firms with scalable platforms, deeper client relationships, and a higher share of recurring revenue appear better positioned to sustain growth and navigate market cycles.
However, despite higher AUM and the long-term structural opportunity, wealth management businesses remain cyclical, as revenue growth is still influenced by equity market performance. Still, given the long runway for financial wealth creation in India, these companies could be worth keeping on your watchlist.
Disclaimer
Note: Throughout this article, we have relied on data from http://www.Screener.in and the company’s investor presentation. Only in cases where the data were unavailable have we used an alternative, widely accepted source of information.
The purpose of this article is only to share interesting charts, data points, and thought-provoking opinions. It is NOT a recommendation. If you wish to consider an investment, you are strongly advised to consult your advisor. This article is strictly for educational purposes only.
About the Author: Madhvendra has been deeply immersed in the equity markets for over seven years, combining his passion for investing with his expertise in financial writing. With a knack for simplifying complex concepts, he enjoys sharing his honest perspectives on startups, listed Indian companies, and macroeconomic trends.
A dedicated reader and storyteller, Madhvendra thrives on uncovering insights that inspire his audience to deepen their understanding of the financial world.
Disclosure: The writer and his dependents do not hold the stocks discussed in this article. The website managers, its employee(s), and contributors/writers/authors of articles have or may have an outstanding buy or sell position or holding in the securities, options on securities, or other related investments of issuers and/or companies discussed therein. The articles’ content and data interpretation are solely the personal views of the contributors/ writers/authors. Investors must make their own investment decisions based on their specific objectives, resources, and only after consulting such independent advisors as may be necessary.


