

Markets have a habit of falling in love with quarterly numbers.
One good quarter suddenly becomes the beginning of a new growth cycle. One weak quarter is treated as evidence that a company’s best days are behind it. Neither is usually true.
Styrenix Performance Materials is a good example. The company manufactures engineering plastics such as Acrylonitrile Butadiene Styrene, Styrene Acrylonitrile and Polystyrene, which are used in products ranging from automobiles and consumer appliances to electrical equipment and electronics. As India manufactures more of these products, demand for engineering plastics tends to rise.
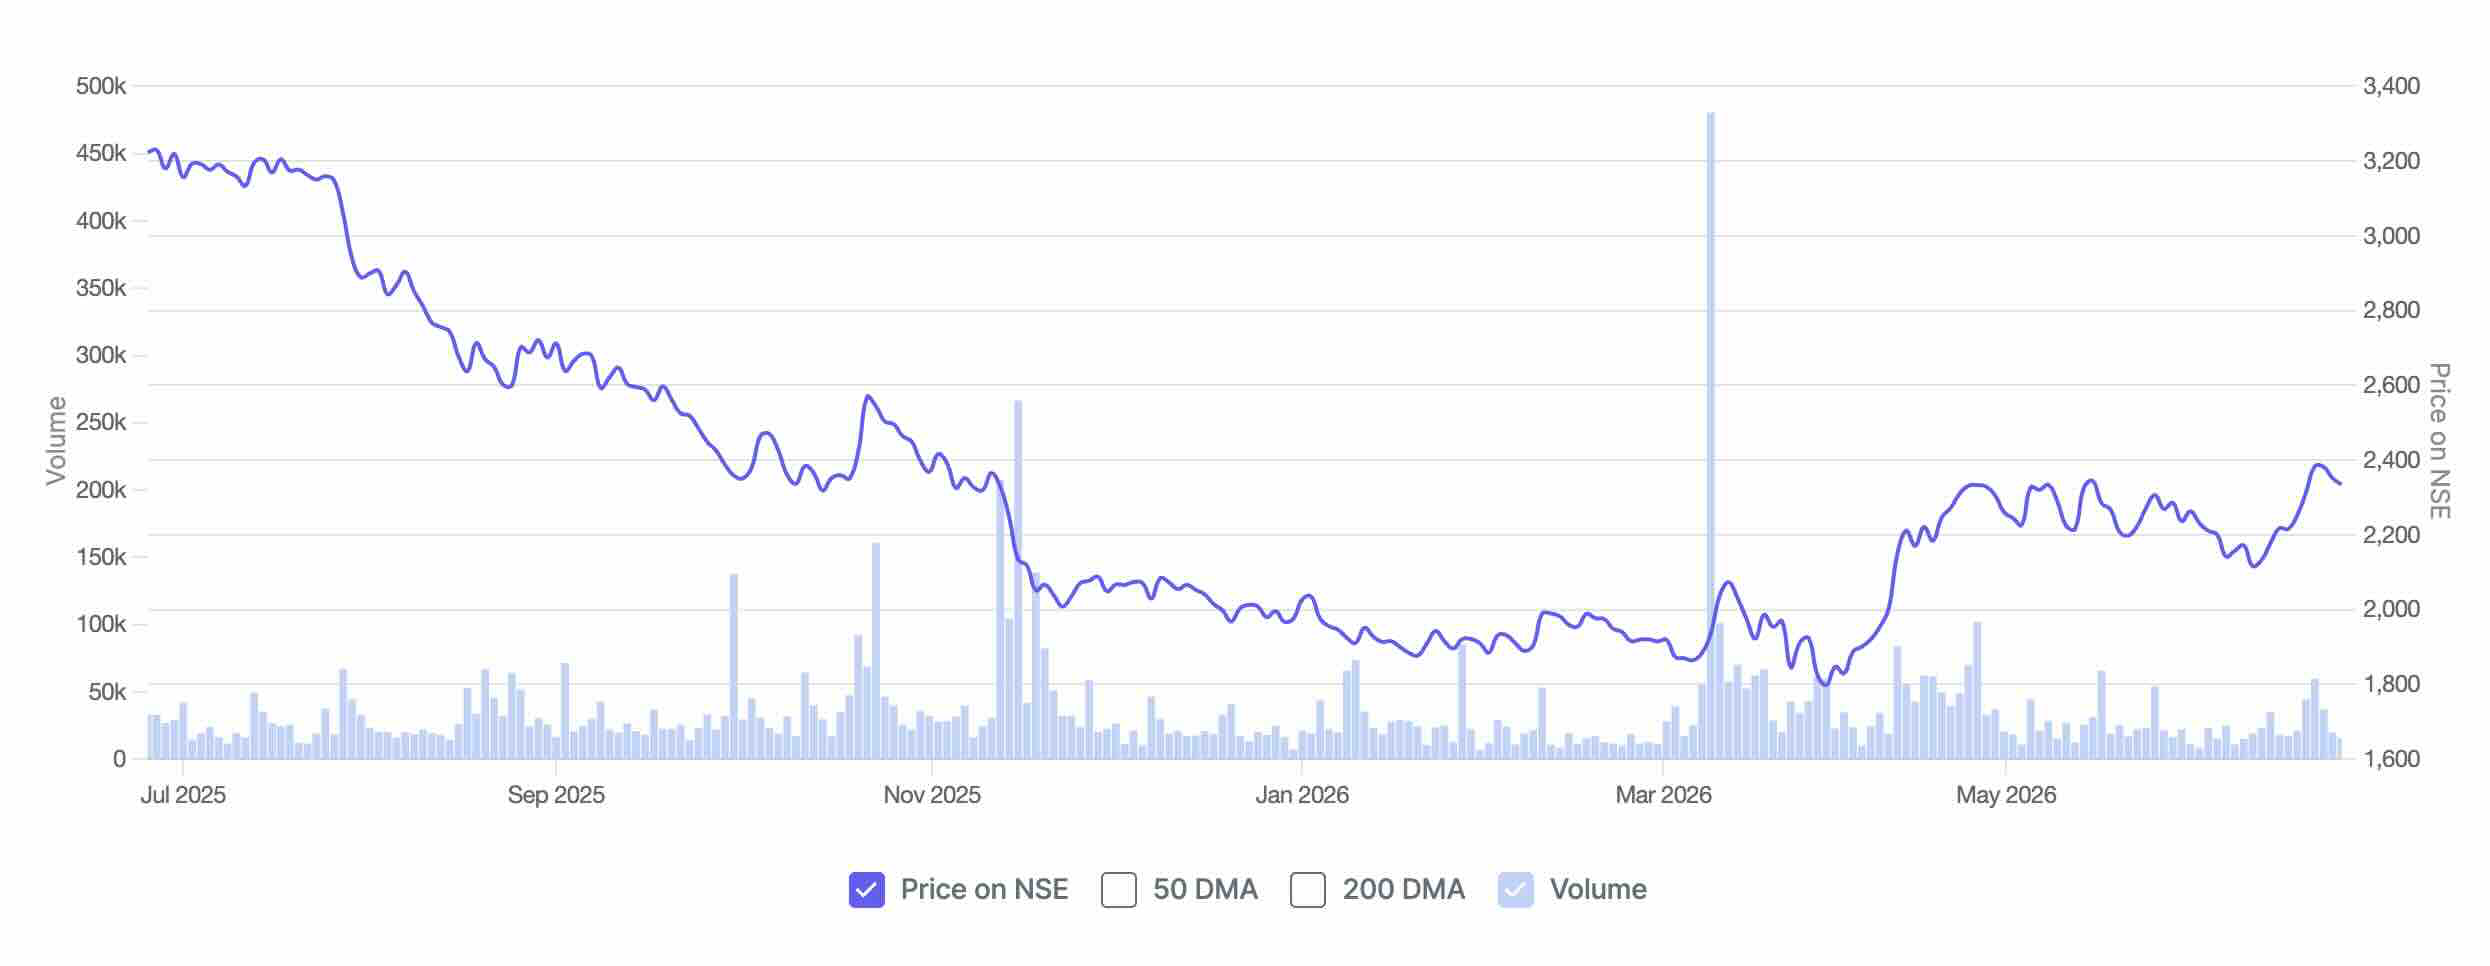
Styrenix Performance Materials Ltd. 1-Year Share Price Chart
Its March quarter looked exceptional. Operating margins jumped to 19.2% from 11.8% a year earlier, while profit after tax surged nearly 59%. Unsurprisingly, most discussions around the company have centred on one question: Can these margins sustain?
That may well be the wrong question. The March quarter was unusual because of global events that were largely outside the company’s control.
The more important question is whether India still needs to import large quantities of engineering plastics despite its manufacturing ambitions. If the answer is no, Styrenix’s long-term opportunity has very little to do with one strong quarter and much more to do with its ability to replace imports and expand capacity.
The more important question is whether India’s dependence on imported engineering plastics will continue over the coming years. If it does, Styrenix’s long-term opportunity lies in replacing those imports while expanding capacity to meet rising demand.
First, let’s understand what really happened
The headline numbers appear confusing. Standalone revenue fell 3.8% during FY26. Yet the company sold 5.2% more material than it did a year earlier. Usually, selling more products leads to higher revenue.
Not this time. Styrenix operates in a business where prices are determined less by management and more by global petrochemical markets. During much of FY26, prices of crude oil-linked feedstocks softened. Selling prices for engineering plastics followed. As a result, the company sold more material but realised lower prices, pulling down reported revenue.
What changed in FY26?
| FY26 | What happened | Why it matters |
| Revenue | Declined | Lower polymer realisations |
| Volumes | Increased | Demand remained healthy |
| EBITDA margin | Expanded | Better spreads and product mix |
| Profit | Increased | Higher margins offset lower revenue |
Demand was never really the problem.
The March quarter told a different story. Geopolitical tensions in the Middle East disrupted global petrochemical supply chains. Prices of key raw materials started rising.
Normally, that squeezes manufacturers because costs rise faster than selling prices. Styrenix managed to avoid that.
Management said the company was able to pass on higher raw material costs to customers. There were no meaningful inventory gains either. Instead, improved pricing spreads, a better product mix and lower operating costs combined to produce one of the strongest quarters in the company’s recent history.
But management repeatedly cautioned investors against treating the March quarter as the new normal. That is worth remembering because commodity businesses often produce spectacular quarters near the top of a pricing cycle. Investors who assume those margins will continue indefinitely are usually disappointed.
So if margins are not the story, what is?
The answer lies in something far more mundane. India still imports a significant portion of the engineering plastics it consumes.
That may sound surprising. The country manufactures automobiles, air conditioners, refrigerators, televisions and increasingly electronic products. Yet a substantial part of the engineering plastics required by these industries still comes from overseas.
According to Styrenix’s management, India consumes around 350,000 to 370,000 tonnes of Acrylonitrile Butadiene Styrene every year. Domestic producers currently meet less than half that demand. Even after announced capacity additions across the industry, more than 100,000 tonnes may continue to be imported.
This is where the investment thesis begins. Unlike many commodity businesses that depend mainly on pricing, Styrenix has another lever for growth. It can simply replace imports.
Management also believes demand itself is growing by around 30,000 to 50,000 tonnes every year as automobiles, consumer appliances, electrical equipment and consumer electronics expand. That means the market is not merely replacing imports. It is becoming larger every year.
If that estimate proves correct, the opportunity extends well beyond one commodity cycle.
The company’s strategy reflects that thinking
Styrenix is not trying to chase higher prices. It is trying to increase capacity. Its planned Acrylonitrile Butadiene Styrene expansion is expected to add roughly 70,000 tonnes of annual capacity, nearly doubling the company’s existing capability over time.
The investment of around Rs 600-700 crore will be phased, allowing capacity to be commissioned gradually instead of all at once. The Thailand business fits into the same strategy.
Key Monitorables
| What to monitor | Why it matters |
| ABS volumes | Determines whether demand remains healthy |
| EBITDA margins | Indicates whether spreads are normalising |
| ABS expansion progress | Drives future earnings growth |
| Thailand utilisation | Tests export strategy |
| Imports into India | Measures size of opportunity |
The Thailand acquisition goes beyond simply adding another manufacturing facility. It gives Styrenix a production base closer to customers across South East Asia at a time when manufacturers are increasingly diversifying their supply chains. For a company looking to expand beyond India, proximity to export markets could become as important as additional capacity.
Neither initiative guarantees success. Both, however, suggest management is preparing for higher volumes rather than betting on permanently higher margins.
Can the company afford such a large expansion?
This is where the balance sheet becomes important. Large manufacturing expansions often look attractive on paper. They become risky when companies borrow aggressively to fund them.
Styrenix appears better placed than many of its peers. The company’s debt-to-equity ratio stands at 0.24x and it enjoys an interest coverage ratio of over 12 times.
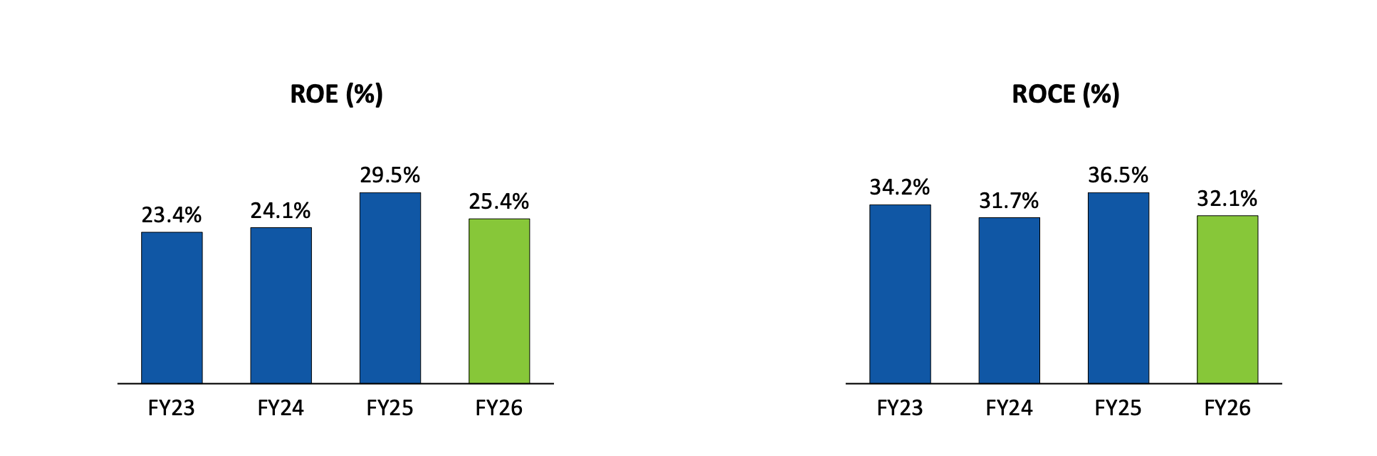
Return on Equity was around 25%, while Return on Capital Employed stood near 32%. Those numbers suggest the existing business continues to generate healthy cash while earning attractive returns.
Return Profile (FY23-26)
Equally important, management is expanding in phases rather than attempting one large investment upfront. That should allow a meaningful portion of the capital expenditure to be funded through internal accruals, reducing the need to overextend the balance sheet.
What is the market really paying for?
Currently, the Styrenix is trading at a PE of 22 times. Investors should probably resist valuing Styrenix on the basis of one quarter’s earnings.
The market is increasingly pricing in a much stronger possibility. It is betting that India will continue replacing imported engineering plastics with domestic production. It is betting that Styrenix will successfully double its capacity. And it is betting that the Thailand business becomes an important regional manufacturing platform.
If those assumptions play out, earnings can continue growing even if operating margins move back towards historical averages. If they do not, the March quarter will end up looking like exactly what management says it is: an unusually good quarter helped by favourable pricing conditions.
The final word
The easiest way to explain Styrenix’s recent performance is to point to the jump in margins. That is also the least interesting explanation.
Margins will rise and fall with commodity cycles. Supply disruptions will eventually ease. Pricing spreads will normalise.
The bigger question is whether India can keep expanding its manufacturing base while continuing to import a large share of the engineering plastics that go into those products.
If that gap persists, companies such as Styrenix have a long runway for growth that extends well beyond one exceptional quarter. And that may ultimately prove far more valuable than a temporary spike in margins.
Disclaimer:
Note: We have relied on data from www.Screener.in throughout this article. Only in cases where the data was not available, have we used an alternate, but widely used and accepted source of information.
The purpose of this article is only to share interesting charts, data points and thought-provoking opinions. It is NOT a recommendation. If you wish to consider an investment, you are strongly advised to consult your advisor. This article is strictly for educative purposes only.
Manvi Aggarwal has been tracking the stock markets for nearly two decades. She spent about eight years as a financial analyst at a value-style fund, managing money for international investors. That’s where she honed her expertise in deep-dive research, looking beyond the obvious to spot value where others didn’t. Now, she brings that same sharp eye to uncovering overlooked and misunderstood investment opportunities in Indian equities. As a columnist for LiveMint and Equitymaster, she breaks down complex financial trends into actionable insights for investors.
Disclosure: The writer and her dependents do not hold the stocks discussed in this article. The website managers, its employee(s) and contributors/writers/authors of articles have or may have an outstanding buy or sell position or holding in the securities, options on securities or other related investments of issuers and/or companies discussed therein. The content of the articles and the interpretation of data are solely the personal views of the contributors/ writers/authors. Investors must make their own investment decisions based on their specific objectives, resources and only after consulting such independent advisors as may be necessary.


