

Radhakishan Damani does not give interviews. He does not post market views. He lets his filings do the talking. And beyond his crown jewel Avenue Supermarts, those filings point to a small clutch of listed companies where the DMart founder has quietly parked money through his investment vehicles.
Two of those names had a rough ride over the past year. One is a mid-sized agrochemical maker from Andhra Pradesh, and the other is a Chennai-based holding company formerly known as Sundaram Finance Holdings. Both slid to their 52-week lows earlier this year. Both then spent the June quarter clawing their way back. At recent prices, the two stakes together are worth close to Rs 310 cr.
With Q2FY26 (July-Sept) just starting, fresh exchange filings will land over the coming weeks and tell us if the companies have what it takes to continue the run. But before they do, the numbers already on record make for a fascinating study in contrasts. Let us dive in.
#1 Bhagiradha Chemicals: A 65% Rebound Priced Like a Growth Stock
Bhagiradha Chemicals and Industries makes insecticides, fungicides and herbicides from its base in Ongole, Andhra Pradesh. Its portfolio runs to 32 active ingredients, including well-known molecules like Chlorpyrifos, Fipronil and Azoxystrobin.
With a current market cap of Rs 3,662 cr, the company’s R&D team works jointly with multinational partners from Japan, USA, and Israel, leveraging a library of 120+ proven reactions across 25+ chemistries, enabling the development of complex molecules and new technologies.
Damani has been holding the stock through Derive Trading and Resorts Private Limited, his investment vehicle, since the quarter ending June 2024 per Trendlyne. At the end of March 2026 his holding was 3.3% which currently is worth about Rs 122 cr.
Unpacking the 65% Bhagiradha Rebound
The share price of Bhagiradha Chemicals was about Rs 55 in July 2021 and as of closing on 2nd July 2026 it was Rs 282 which is a jump of over 410% in 5 years. Rs 1 lakh invested in the stock 5 years ago would have been over Rs 5.10 lakhs today.
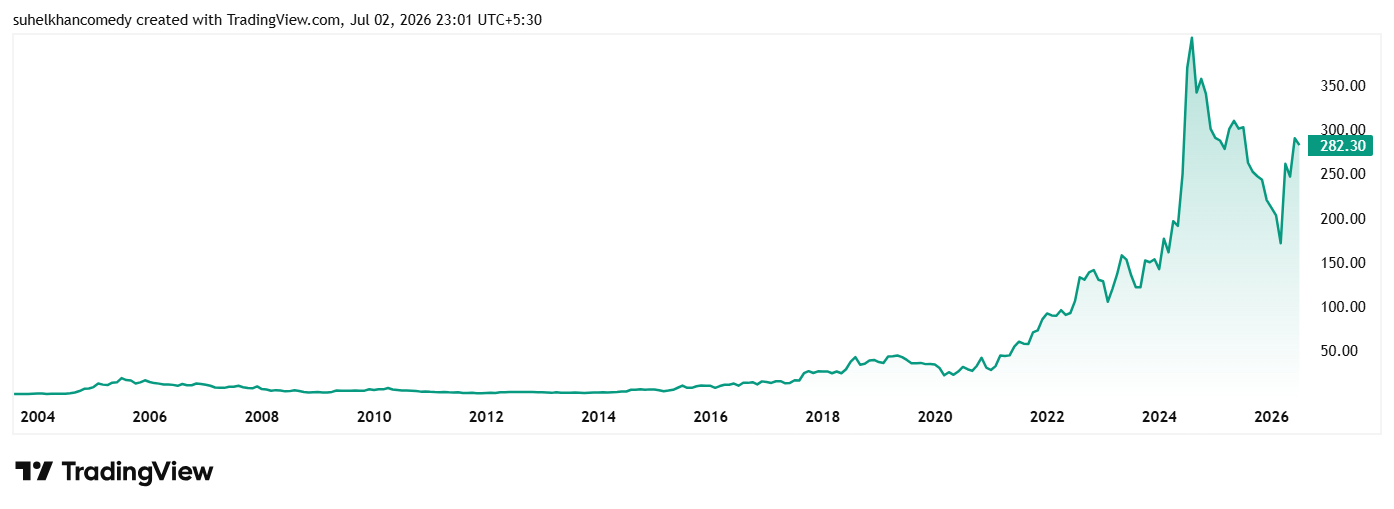
However, if you look closely, the stock hit its all-time high of Rs 448 in August 2024, and since then was on a downward spiral. It hit its 52-week low of Rs 170 in March. Things changed after that as the stock started climbing again, thanks to a strong jump in sales and operating profits.
Between the final days of March 2026 and 2nd July 2026, the stock jumped by 65%. This 65% recovery leaves it just 13% short of its 52-week high of Rs 325.
Let us look at the financials to see if the company has what it takes to keep up the climb.
| Financial Year | FY21 | FY22 | FY23 | FY24 | FY25 | FY26 | 5-yr CAGR |
| Sales (Rs Cr) | 318 | 436 | 502 | 408 | 440 | 536 | 11% |
| EBITDA (Rs Cr) | 47 | 68 | 77 | 43 | 37 | 57 | 4% |
| Net Profit (Rs Cr) | 23 | 36 | 45 | 18 | 14 | 18 | Drop |
Sales compounded at 11% a year, but the journey was anything but smooth. Revenue peaked at Rs 502 cr in FY23, then dropped to Rs 408 cr in FY24 as global agrochemical buyers ran down their inventories and prices crashed. FY26 finally brought a proper recovery, with sales growing 22% to a new high of Rs 536 cr.
Profits have not kept pace. Net profit went from Rs 45 cr in FY23 to Rs 18 cr in FY26. Operating margins, which touched 16% in FY22, now sit at 11%. Return on capital employed, which was 25% in FY22, has slipped to about 5%. Over five years, net profit has actually shrunk at 4% a year.
But some context could help here. The entire agrochemical industry went through a brutal two-year stretch. Global distributors cut inventories to the bone, cheap supply flooded the market, and prices collapsed across the board. Bhagiradha did not escape, and its numbers carry the scars.
Why the Market is Pricing in a Massive Expansion
One question that will surely come up is, why would a stock with shrinking profits recover 65% from its low? Because the market is not paying for what Bhagiradha earned last year. It is paying for what a massive expansion might earn in the years ahead.
The balance sheet reveals some interesting figures. Fixed assets jumped from Rs 245 cr to Rs 581 cr in a single year as a new manufacturing site built under its subsidiary went live. Borrowings swelled from Rs 89 cr to Rs 235 cr to fund it. Annual interest costs more than doubled from Rs 7 cr to Rs 17 cr. Free cash flow was negative Rs 148 cr in FY26, on top of negative Rs 302 cr in FY25.
New capacity plus new debt plus higher depreciation is a recipe for depressed earnings today and, if utilisation ramps up, much bigger earnings tomorrow.
The Valuation Disconnect: Is 200x PE Justified?
Here is the uncomfortable part. At around Rs 282, the stock trades at a PE of about 200x and the industry median is a mere 22x. A meaningful comparison with the stock’s own 10-year median PE is not possible either, since consolidated financials go back only to FY20 and earnings have moved too wildly for a median multiple to mean much.
Two more data points deserve attention. Promoter holding is low at 19.6% and has slipped from 23.52% three years ago. Meanwhile, the shareholder count has tripled from 4,292 in March 2024 to 12,815, which tells you retail investors have rushed in. The past has been spectacular. The price now demands that the future be impressive too.
#2 TSF Investments: Deep Value or Value Trap?
If Bhagiradha is a factory bet, TSF Investments is a vault. The company, which changed its name from Sundaram Finance Holdings in October 2025, is a core investment company from the TVS-Sundaram stable in Chennai.
With a market cap of Rs 10,039 cr, the company’s worth lies in the stakes it holds in 12 group companies, including auto component heavyweights like Brakes India, Turbo Energy and Wheels India. It still maintains minority investments in TVS Holdings Limited (6.49%), Sundaram Clayton Limited (7.49%), and Lucas-TVS Limited (6.62%).
Damani has been holding a stake in the company through Bright Star Investments since the quarter ending March 2018 per Trendlyne. He currently holds 1.9% stake which in terms of the current price is worth about Rs 189 cr.
Tracking the 530% Climb and the 19x PE Anomaly
The share price of TSF Investments was about Rs 75 in July 2021 and as of closing on 2nd July 2026 it was Rs 452, which is a jump of over 530% in 5 years. Rs 1 lakh invested in the stock 5 years ago would have been over Rs 6 lakhs today.
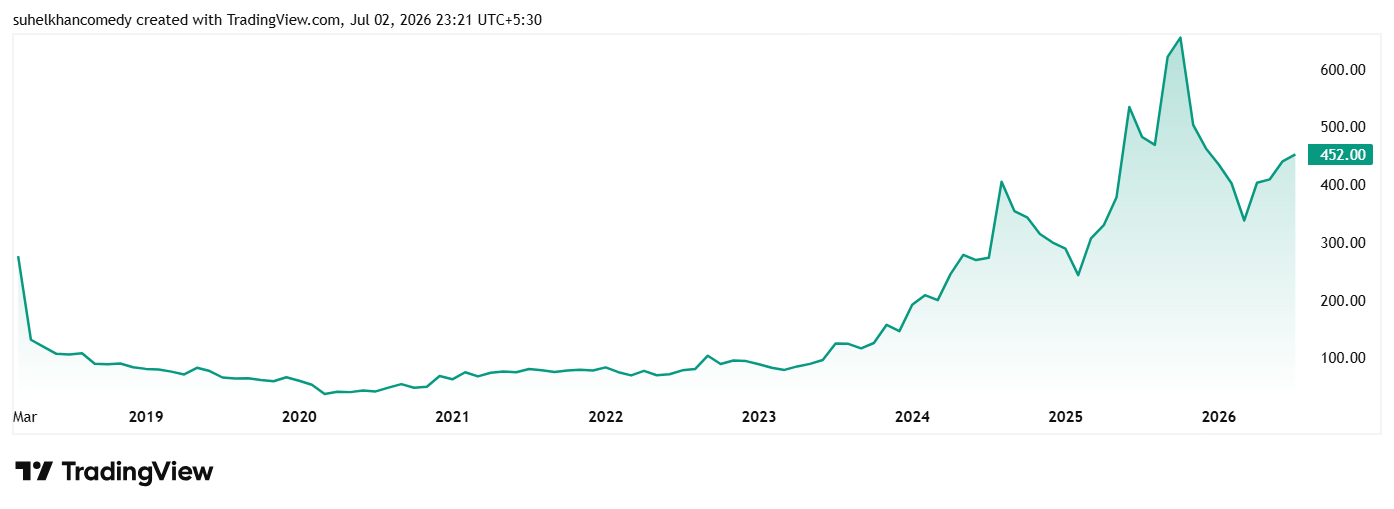
Look closely and you will see that the stock hit a 52-week high of Rs 702 around October 2025, crashed to a low of Rs 331 in April 2026, and has since recovered about 36% to its current price of RS 452. That still leaves it 36% below its 52-week peak of Rs 702.
On valuation, the stock trades at a PE of about 19x while the industry median is 32x. The 10-year median PE for the company is 13x, while the industry median for the same period is 19x.
Top-Line Illusions vs. Bottom-Line Reality
Let us look at the financials.
| Financial Year | FY21 | FY22 | FY23 | FY24 | FY25 | FY26 |
| Sales (Rs Cr) | 59 | 85 | 91 | 291 | 155 | 985 |
| EBITDA (Rs Cr) | 10 | 24 | 46 | 243 | 116 | 203 |
| Net Profit (Rs Cr) | 74 | 161 | 238 | 533 | 412 | 530 |
While the sudden revenue jump to Rs 985 cr might look like a miraculous growth story on paper, it is largely an accounting illusion typical of holding companies. For investment firms, these massive top-line spikes usually point to a one-off asset liquidation or the sudden consolidation of a subsidiary, rather than a fundamental boom in core operations.
A quick glance at the bottom line confirms this reality. Despite the staggering 500% surge in reported sales, actual net profits grew at a much more grounded pace, signalling that this top-line explosion didn’t bring a proportional wave of cash into the business.
The FII Accumulation Signal
The shareholding pattern carries a signal of its own. Promoters hold a firm 55%. Foreign institutional investors (FIIs), who owned just 0.23% in March 2024, have lifted their stake steadily to 3.20% by March 2026.
Somebody has been accumulating precisely while the stock was falling. The company has also been a steady payer, with a dividend yield of 2.5% in a flat market.
There is comfort in the cash too. Operating cash flow has been positive in every one of the last eight years on record, and free cash flow came in at Rs 263 cr in FY26. The company is almost debt free at the parent level. For a business whose job is to sit on valuable assets and pass income along, that is exactly the profile you want to see.
Growth Bet vs. Asset Vault: The Big Question
If we take away the common Damani connection, these stocks could not be more different. Bhagiradha is a leveraged expansion story trading at 200 times depressed earnings. Everything must go right, and quickly, for the price to make sense. TSF is the opposite. It trades below the net worth of what it holds, pays steady dividends and carries a 55% promoter shield, but its low return on equity and holding company structure mean the discount could persist for years.
For Bhagiradha, it would be fascinating to watch whether the new capacity converts into revenue and whether debt starts coming down over the next few quarters. For TSF, one must watch whether the FII accumulation continues and whether the gap between price and underlying worth begins to close.
Neither stock is a simple buy-the-dip story. Both are worth understanding. That is exactly what a watchlist is for.
Disclaimer:
Note: We have relied on data from http://www.Screener.in and http://www.trendlyne.com throughout this article. Only in cases where the data was not available, have we used an alternate, but widely used and accepted source of information.
The purpose of this article is only to share interesting charts, data points and thought-provoking opinions. It is NOT a recommendation. If you wish to consider an investment, you are strongly advised to consult your advisor. This article is strictly for educative purposes only.
Suhel Khan has been a passionate follower of the markets for over a decade. During this period, he was an integral part of a leading Equity Research organisation based in Mumbai as the Head of Sales & Marketing. Presently, he is spending most of his time dissecting the investments and strategies of the Super Investors of India.
Disclosure: The writer and his dependents do not hold the stocks discussed in this article. The website managers, its employee(s), and contributors/writers/authors of articles have or may have an outstanding buy or sell position or holding in the securities, options on securities or other related investments of issuers and/or companies discussed therein.


