

When we think about largecaps, we usually consider the financial health of the companies to be better than that of other mid and smallcap companies.
However, that might not always be the case!
When we tried to find largecap stocks with a perfect Piotroski score of 9, a financial metric that indicates the financial health of any company, we just found two of them.
And surprisingly, both are from the same sector – the pharmaceutical sector.
During 2025, this sector had a domestic market size of around USD 60 billion, which is projected to reach a whopping USD 130 billion by 2030.
The Indian pharmaceutical industry is already the 3rd largest in the world by volume and 11th by value.
During FY25, the annual turnover of the industry stood at ₹4.72 lakh crore, and exports stood at USD 30.5 billion.
In the first half of FY26, Foreign Direct Investment (FDI) in this sector surged to ₹13,193 crore, and with the Biopharma Shakti proposal in the Union Budget 2026-2027, India’s pharma sector is poised to become one of the biggest global pharmaceutical manufacturing hubs.
The above numbers perhaps indicate the reasons behind the two largecap stocks with the perfect Piotroski score being from this sector only.
Let’s explore both stocks.
#1 Sun Pharmaceutical Industries Limited: The Largest Company of All
Sun Pharmaceutical Industries Ltd. is the largest pharmaceutical company in the country with a market capitalisation of over 4 lakh crore (as of 2 April 2026). It has a global presence in over a hundred countries, and it is the 13th largest pharma brand in the US generic medicine market as well.
The company offers generic medicines, branded generics, innovative medicines, and APIs. There are 40 manufacturing facilities with different manufacturing capabilities, which include ointments, liquid medicines, tablets, injectables, capsules, and more.
It is not just the global presence that sets Sun Pharma apart, but its research and development capabilities, which make it truly global.
Diversified Revenue Base
During Q3FY26, Sun Pharma generated a gross sale of around ₹15,469 crore. US formulations contributed to 28% of this sale value, that is around ₹4,250 crore, which is a 6.2% YoY increase from the ₹4,030 crore generated in Q3FY25.
The Indian formulation market contributed to 32% of the sales during the quarter, which is around ₹4,999 crore, up 16.2% from the corresponding quarter last fiscal.
Emerging Markets constituted 19% of the gross sales, which amounts to around ₹2,999 crore, which is a whopping 28.3% rise from ₹2,338 crore of Q3FY25.
The rest of the world made another 17% while the APIs and others made the remaining 4% of the gross sales. Though APIs witnessed a drop in sales by 4.7% during the quarter, sales from the rest of the world surged by a massive 20.8%.
Checkpoint Therapeutics Inc. Acquisition
During 2025, Sun Pharma acquired Checkpoint Therapeutics Inc., which is the only and first-ever US FDA-approved Anti-PD-L1 antibody for cutaneous squamous cell carcinoma.
This acquisition is expected to strengthen the oncology-dermatology profile of the company and will help the company expand its innovative, high-potential specialty therapeutics segment as well.
Massive R&D Capabilities
Between FY21 and FY25, the company’s spending on research and development (R&D) has gone up from ₹2,150 crore to ₹3,250 crore, which is on average 6% of the sales.
As of 31 December 2025, the company has 666 filed Abbreviated New Drug Applications (ANDAs), while 550 are approved. Then there are 71 NDA which are filed, and 57 have been approved. The number of filed patents stood at 3,285 and approved at 2,515 as of the date.
Financials and Ratios
Sales during 9MFY26 stood at ₹43,850 crore, up from ₹39,619 crore generated in 9MFY25, logging a 10.7% YoY rise.
Adjusted net profit for the period surged from ₹9,095 crore to ₹9,651 crore, increasing at 6.1% YoY.
The adjusted earnings per share (EPS) (diluted) jumped from ₹38 per share to ₹40 per share during the period, logging 6.1% YoY growth.
Even being the largest company in the industry, Sun Pharma offers a return on capital employed (ROCE) of 20.2% while the rest of the industry has a median ROCE of 15.1%.
Sun Pharma also has a better dividend yield compared to most of its peers. The current dividend yield is 0.94%, while the industry median is just 0.1%.
The company has one of the lowest debt-to-equity ratios in the industry. Currently, it is around 0.07%, way lower than the industry median of 0.22%.
Note: 9MFY26 net profit has been adjusted with ₹885 crore for impairment charges, additional provisions, legal charges, and benefit from deferred tax adjustment, while the 9MFY25 profit was adjusted for litigation settlement worth ₹316 crore.
Valuation
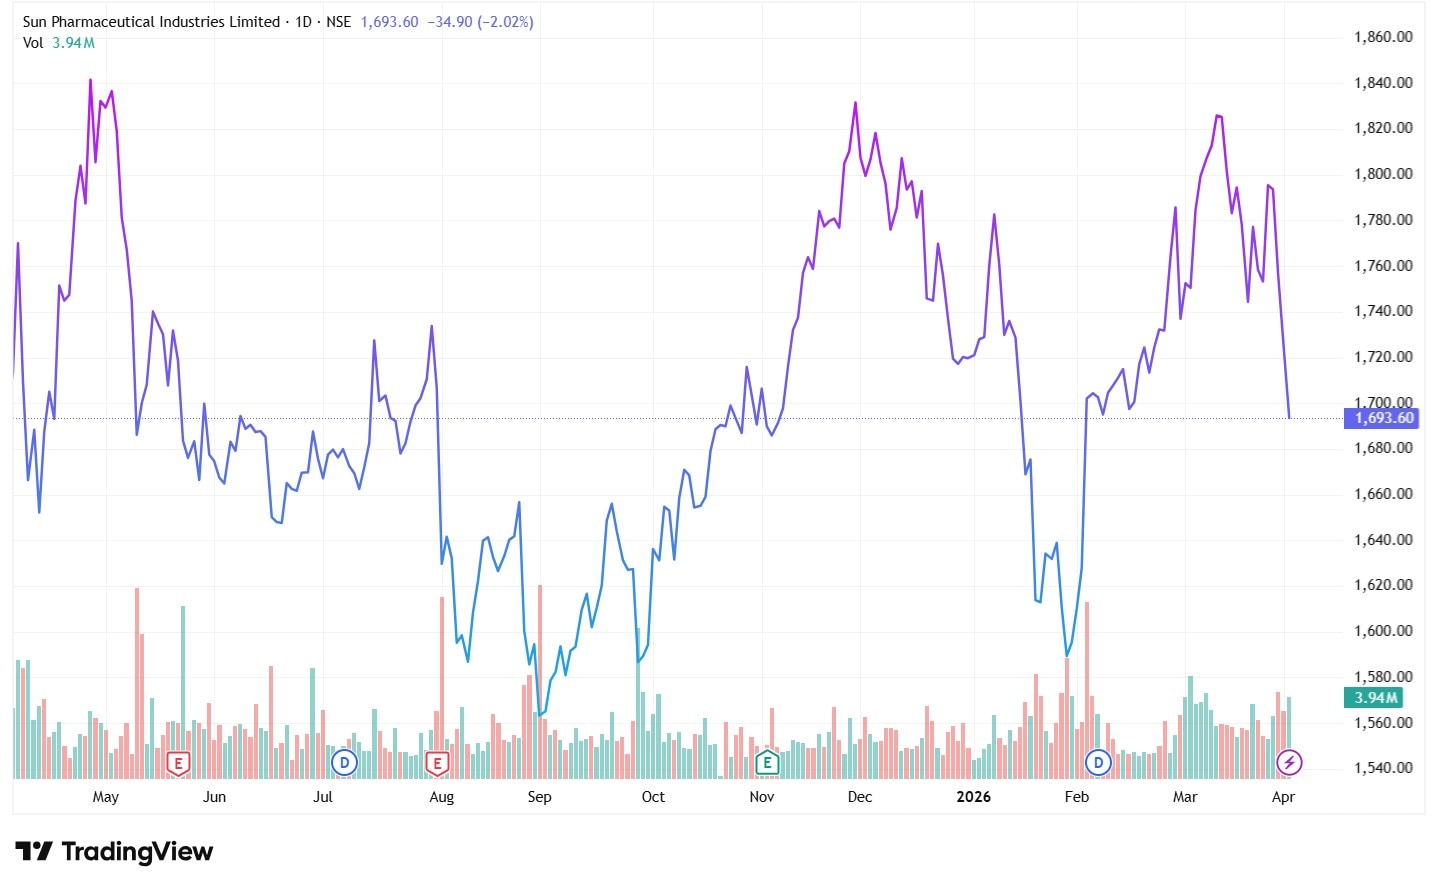
The stock is trading at a price/earnings (PE) of 33.5x, while the industry median is 27.1x. The price/earnings to growth (PEG) ratio stood at 1.7x, more than double the industry median of 0.8x, indicating that even adjusted for growth, this pharma giant is trading at a premium to its peers.
1-Year Share Price Chart of Sun Pharmaceutical Industries Ltd.
#2 Torrent Pharmaceuticals Limited: The Branded Generic Giant
Torrent Pharmaceuticals Ltd. is the 3rd largest pharma business in the country with a market capitalisation of ₹1,34,945 crore (as of 2 April 2026). The company is focused on the branded generic medicine segment, which offers different medicines for cardiovascular, gastrointestinal, dermatological diseases, diabetes, pain management, and nervous system-related issues, and gynaecology as well.
Apart from branded generics, it also offers generic medicines, especially in the US, European, and emerging markets, where they produce the generic version of the drugs whose patents have expired, or there are regulatory approvals for the same.
Key Growth Drivers: India and Brazil
The company generates the highest revenue from the Indian market itself. During Q3FY26, the revenue generated from the Indian market stood at ₹1,798 crore out of the total revenue for the period. On the other hand, Brazil contributed another ₹371 crore, the US contributed ₹321 crore, followed by Germany with ₹304 crore, and the rest of the world combined contributed ₹509 crore.
In India, the revenue was mainly driven by chronic and sub-chronic segments where Torrent Pharma has a leadership in the market, especially in the cardiac, gastro, and diabetes segments.
Curatio Healthcare, which was acquired by Torrent Pharma in 2022 to strengthen its position in the derma segment, is also scaling new highs. During the quarter, revenue jumped by 27%, driven by strong demand generated through OTC advertisements and field force expansion.
Coming to the Brazilian market, healthy volume growth and nominal price increase boosted the sales. Torrent Pharma has around 60 new molecules planned for this market, which are awaiting approval from Agência Nacional de Vigilância Sanitária (ANVISA), the drugs regulator in Brazil.
JB Pharma Acquisition
In January 2026, Torrent Pharma acquired 46.39% of JB Chemicals & Pharmaceuticals Ltd. (JB Pharma) and 2.41% extra from the employees, totalling 48.8%, which is a controlling interest. The company expects the integration to take place within the next 6 to 9 months.
This acquisition is expected to strengthen the position of Torrent Pharma in the pharma market in India, especially in the chronic therapies segment, such as cardiology, nephrology, and others.
The management is expecting cost efficiency gains of around ₹400 crore to ₹450 crore over the next 2 years from this acquisition across procurement of raw materials, manufacturing, and R&D.
Financials and Ratios
Sales grew by 14% YoY to ₹9,783 crore in 9MFY26 from ₹8,557 crore in 9MFY25. Net profit for the period increased from 1,413 crore to ₹1,774 crore, logging a 25.5% YoY growth.
In terms of returns, Torrent Pharma clocked a ROCE of 27.1%, which is way higher than the industry median of 15.1% and also higher than the ROCE of Sun Pharma.
Coming to dividends, the yield is 0.8%, way higher than the industry median, and slightly lower than Sun Pharma.
The debt-to-equity ratio stood at 0.33%, a bit higher than the industry median of 0.22%; however, the company has reduced debt in recent quarters. From a total debt of ₹3,202 crore at the end of March 2025, the company reduced it to ₹2,822 crore by the end of September 2025.
Valuation
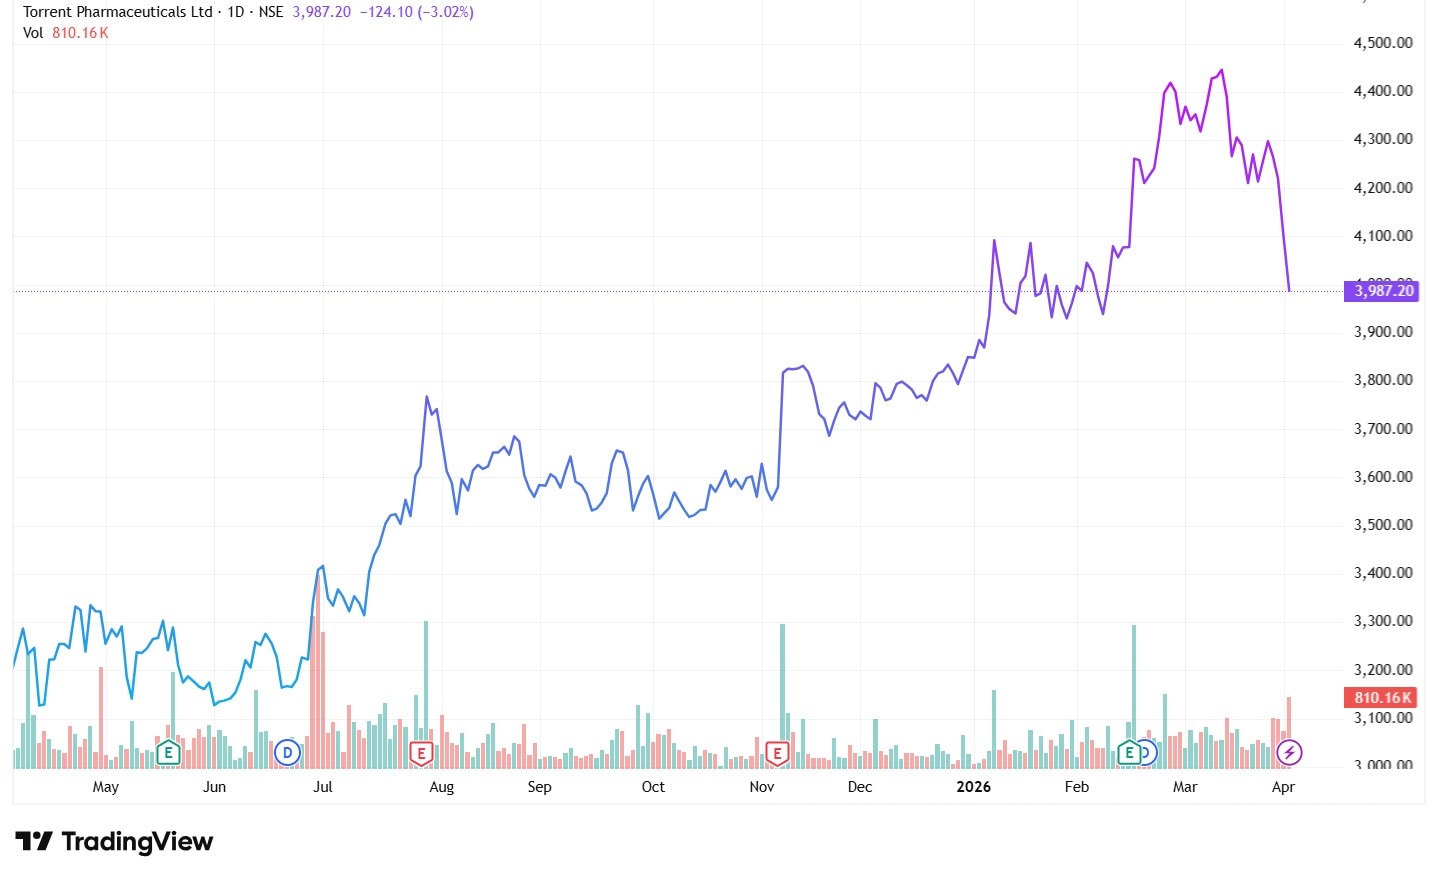
The stock is trading at a PE of 58.5x, while the industry median is 27.1x. The PEG ratio is at 2.8x, way higher than the industry median, indicating a premium valuation even when adjusted for growth.
1-Year Share Price Chart of Torrent Pharmaceuticals Ltd.
Final Thoughts
Both the companies’ financials suggest why they have a perfect Piotroski score. From growing sales and profits, to reducing and almost debt-free structures, along with return ratios higher than the industry median, both these largecap pharma giants have a perfect Piotroski score.
Having said that, as the markets are highly volatile owing to geopolitical tension, it will be wise to add these stocks to your watchlist to track their future performance.
Disclaimer:
We have relied on data from www.Screener.in throughout this article. Only in cases where the data was not available have we used an alternate, but widely used and accepted source of information.
The purpose of this article is only to share interesting charts, data points, and thought-provoking opinions. It is NOT a recommendation. If you wish to consider an investment, you are strongly advised to consult your advisor. This article is strictly for educational purposes only.
Maumita Mitra is a seasoned writer specializing in demystifying the world of investment for a broad audience. She has a keen eye for detail and a knack for explaining complex financial concepts in the simplest manner possible.
Disclosure: The writer and her dependents do not hold the stocks discussed in this article.
The website managers, their employees (s), and contributors/writers/authors of articles have or may have an outstanding buy or sell position or holding in the securities, options on securities, or other related investments of issuers and/or companies discussed therein. The content of the articles and the interpretation of data are solely the personal views of the contributors/ writers/authors. Investors must make their own investment decisions based on their specific objectives, resources, and only after consulting such independent advisors as may be necessary.


